Spotting Hurst Cycles in the Spectrum: A Conversion Table from Weekly to Intraday
A conversion table and a three-layer gating rule for matching detected periods to J.M. Hurst's eleven named cycles, on any instrument and any timeframe.
Spotting Hurst cycles in the spectrum means matching a detected period on your cycle-spectrum table to one of J.M. Hurst's eleven named nominal cycles (5-day, 10-day, 20-day, 40-day, 80-day, 20-week, 40-week, 18-month, 54-month, 9-year, 18-year) by converting the calendar wavelength into the right bar count for your timeframe and asset class. A detected period earns the Hurst-nominal label only when three conditions hold together: Bartels-significance (the entry filter every spectrum row already passed), prominence (top 7 by Fit or carrying the orange strength-rank dot), and tolerance (the wavelength sits inside roughly plus-or-minus 10 to 15 percent of one of the eleven nominals on the relevant timeframe column).
You opened the spectrum. Now what is it telling you?
You ran an analysis on your favourite instrument, opened the cycle spectrum, and you are looking at row three. The period reads 79. Is that the famous 80-day cycle J.M. Hurst wrote about in 1970, or a coincidence the algorithm picked up?
Most retail readers fail at this question in two opposite directions. Some over-name. Every period gets a Hurst label, every spectrum becomes a tidy nested hierarchy, and the reader walks away with false conviction. Others under-name. They miss obvious nominal hits because the bar count looks nothing like 80, even though the underlying calendar wavelength is a textbook match. Both errors come from the same gap: not knowing the conversion math, and not knowing which detected cycles deserve a Hurst-nominal label in the first place.
This article gives you the table and the rule. By the end you will be able to look at any spectrum, on any timeframe, on any asset class, and answer the question in under thirty seconds. We work three real captures from FractalCycles on the S&P 500 daily, BTC-USD on the one-hour chart, and the S&P 500 weekly to make the conversion concrete.
The eleven named cycles, refreshed
J.M. Hurst's nominal cycle hierarchy is the workhorse list. He published the model in The Profit Magic of Stock Transaction Timing (Prentice-Hall, 1970), then expanded and refined it in his Cyclitec Cycles Course, taught between 1973 and 1975. The canonical eleven-component list for end-of-day analysis, with average wavelengths in calendar days, is the following:
| # | Cycle name (nominal) | Average wavelength (calendar days) |
|---|---|---|
| 1 | 18 year | 6,547.2 |
| 2 | 9 year | 3,273.6 |
| 3 | 54 month | 1,636.8 |
| 4 | 18 month | 545.6 |
| 5 | 40 week | 272.8 |
| 6 | 20 week | 136.4 |
| 7 | 80 day | 68.2 |
| 8 | 40 day | 34.1 |
| 9 | 20 day | 17 |
| 10 | 10 day | 8.5 |
| 11 | 5 day | 4.3 |
Source: J.M. Hurst, Cyclitec Cycles Course (1973-75), nominal cycle hierarchy. Wavelengths reproduced from David Hickson's practitioner commentary on the same model.
Two things to notice. First, the labels are bucket names, not literal periods. The 80-day bucket has an average wavelength of 68.2 calendar days. The 18-year bucket has an average wavelength closer to 17.93 years. Hurst's own framing in the Cyclitec Course: "Because of the Principle of Variation, we know that cycles are constantly varying in wavelength, and so describing a cycle by its current, or most recent wavelength is often confusing." The bucket label is shorthand for a neighbourhood, not a fixed number.
Second, every adjacent pair sits in a 2:1 ratio. 80 day to 40 day, 40 day to 20 day, 20 week to 80 day at the 2x level, all the way up to 18 year and 9 year. This nested doubling structure is the mechanical fingerprint of the model and the reason a single cycle rarely appears in isolation.
Hurst's principles, and why they matter for reading a spectrum
Eight principles govern the nominal model, formulated by Hurst in the Cyclitec Course. They look abstract on first read, and they become concrete the moment you start matching detected periods against named cycles.
- Commonality. "All equity (or forex or commodity) price movements have many elements in common." The same eleven buckets appear across instruments and asset classes; you do not need a different list for FX or crypto.
- Cyclicality. "Price movements consist of a combination of specific waves and therefore exhibit cyclic characteristics." Price is a sum of repeating components, not a single trend with noise.
- Summation. "Price waves which combine to produce the price movement do so by a process of simple addition." Spectral decomposition assumes this directly.
- Harmonicity. "The wavelengths of neighbouring waves in the collection of cycles contributing to price movement are related by a small integer value." Inspect the table above and the small integer is almost always 2. Practitioner commentary describes the model as related by simple ratios, most often 2:1 and occasionally 3:1. Treat 2:1 as the baseline expectation, not a Hurst-issued rule.
- Synchronicity. "Waves in price movement are phased so as to cause simultaneous troughs wherever possible." Cycles trough together, which is why nested lows often appear at the same date.
- Proportionality. "Waves in price movement have an amplitude that is proportional to their wavelength." Bigger cycles move price further.
- Nominality. "A specific, nominal collection of harmonically related waves is common to all price movements." This is the sentence that licenses the eleven-bucket list.
- Variation. "The previous four principles represent strong tendencies, from which variation is to be expected."
All eight principle quotations: J.M. Hurst, Cyclitec Cycles Course (1973-75).
The eighth principle, Variation, drives the conversion math. The 80-day bucket averages 68.2 calendar days, but in any given window the realised wavelength might be 60 or 75. Hurst's own caveat in the Cyclitec Coursecaptures the practical consequence: "a specific, or current, cyclic model must be tailored to each issue in the process of analyzing a trading situation." The nominal table tells you where to look. Variation tells you the exact period will wander. Your job is to recognise the wander, not to reject everything that is not 68.2 to two decimals.
The conversion table
Here is the central asset of this article. Pick the named cycle. Pick the timeframe of your chart. Read the period count in bars. The split between crypto (24/7 markets) and equities-RTH (regular trading hours, 6.5 hours per day, five days per week) matters because a calendar day produces a different bar count depending on how many hours of session live inside it.
| Cycle | Calendar days | 1W | 1D crypto | 1D equities RTH | 4H crypto | 4H equities | 1H crypto | 1H equities RTH | 15m crypto | 15m equities RTH |
|---|---|---|---|---|---|---|---|---|---|---|
| 18 year | 6,547.2 | 935 | 6,547 | 4,677 | 39,283 | 7,600 | 157,133 | 30,398 | 628,531 | 121,591 |
| 9 year | 3,273.6 | 468 | 3,274 | 2,338 | 19,642 | 3,800 | 78,566 | 15,199 | 314,266 | 60,795 |
| 54 month | 1,636.8 | 234 | 1,637 | 1,169 | 9,821 | 1,900 | 39,283 | 7,600 | 157,133 | 30,398 |
| 18 month | 545.6 | 78 | 546 | 390 | 3,274 | 633 | 13,094 | 2,533 | 52,378 | 10,133 |
| 40 week | 272.8 | 39 | 273 | 195 | 1,637 | 317 | 6,547 | 1,266 | 26,189 | 5,066 |
| 20 week | 136.4 | 19 | 136 | 97 | 818 | 158 | 3,274 | 633 | 13,094 | 2,533 |
| 80 day | 68.2 | 10 | 68 | 49 | 409 | 79 | 1,637 | 317 | 6,547 | 1,267 |
| 40 day | 34.1 | 5 | 34 | 24 | 205 | 40 | 818 | 158 | 3,274 | 633 |
| 20 day | 17 | 2.4 | 17 | 12 | 102 | 20 | 408 | 79 | 1,632 | 316 |
| 10 day | 8.5 | 1.2 | 8.5 | 6 | 51 | 10 | 204 | 39 | 816 | 158 |
| 5 day | 4.3 | 0.6 | 4.3 | 3 | 26 | 5 | 103 | 20 | 413 | 80 |
Hurst (1973-75) Cyclitec Course wavelengths. Tolerance roughly 10-15% per practitioner convention. Crypto = 24/7 continuous. RTH = NYSE 9:30-16:00 ET, 6.5h. FX (24/5) = use the crypto column for in-session intraday counts, but apply the equities-RTH 5/7 reduction at the daily and weekly bar level (FX closes weekends).
The session conventions baked into the equities columns are the NYSE core trading session, 9:30 a.m. to 4:00 p.m. Eastern, six and a half hours per day, five days per week, and 252 trading days per year. Crypto runs continuously, 24 hours a day, 7 days a week, so a calendar day equals a trading day for crypto. (All accessed 2026-05-06.)
FX is the in-between case. Forex runs 22:00 UTC Sunday to 22:00 UTC Friday (accessed 2026-05-06): 24 hours per weekday, but closed on weekends. For in-session intraday FX bars (1H, 15m, 4H during the trading week) the crypto column applies, because the session itself is continuous. But the daily and weekly bar counts on FX feeds match the equities-RTH columns, because FX closes weekends and a calendar week produces 5 daily bars rather than 7. So for the 80-day cycle: 1H FX in-session reads at the crypto column (~1,637 bars), 1D FX reads at the equities-RTH column (~49 bars).
The line that does the most work in this table is the 80 day row. On a 1H BTC chart it sits at 1,637 bars per cycle. On a 1H SPY chart it sits at 317 bars per cycle. On a 4H crypto chart it sits at 409 bars. Same nominal cycle, three different period numbers, because the bar duration covers a different fraction of the calendar wavelength in each case. Period numbers are not portable across timeframes. The Hurst label is.
The conventional tolerance practitioners apply when matching a detected period to a nominal bucket is roughly plus or minus 10 to 15 percent. So a detected period of 79 on a daily equities chart sits inside the 80-day band (68.2 expected, 79 measured, +16% off, just at the outside edge), and a detected period of 60 sits well outside it (-12% from 68.2 looks fine, but on equities-RTH the 80-day expects 49, not 68; 60 is +22% from 49, outside the band). The plus-or-minus 10 to 15 percent figure is a working-practitioner convention, not a Hurst-issued specification. Hurst's own language is qualitative: variation is to be expected.
The gating rule
Knowing where to expect a Hurst-named cycle is half the job. The other half is deciding which detected periods earn the label and which do not. The discipline is straightforward, and it has three layers.
Every spectrum row already passed the Bartels significance test. This is the entry filter.
The row sits in the top 7 by Fit, or carries the orange strength-rank dot.
The detected period sits inside plus or minus 10 to 15 percent of one of the eleven nominals.
All three must hold. The label stays blank otherwise.
Layer one: significance. Every row in the spectrum table has already cleared a Bartels significance test before it appears. The Bartels test, introduced by Julius Bartels in 1932 and formalised in his 1935 paper "Random fluctuations, persistence, and quasi-persistence in geophysical and cosmical periodicities" (Bartels 1935, accessed 2026-05-06), returns a probability that an observed periodicity exceeds what random walks of the same wavelength would produce by chance. Lower probabilities mean higher confidence the cycle is real. Bartels is the entry filter. Every period you see in the spectrum already passed it.
Layer two: prominence. Significance alone is not enough to anchor a Hurst label. The detected period sits in the top 7 rows by Fit, or the row carries the orange strength-rank dot (top 4 by strength among rows with at least 10% fit). If neither, it is treated as background. Bartels passed it as statistically non-random, but it is not strong enough in this window to anchor a Hurst-nominal interpretation.
Layer three: tolerance. The detected period must fall inside the plus-or-minus 10 to 15 percent band of one of the eleven nominals on the relevant timeframe column.
Significance, prominence, tolerance. Three conditions, all of which must hold. Bartels does not name cycles. Top-of-spectrum rank does not name cycles. Tolerance does not name cycles. The combination does. This is also the framing for the upcoming Hurst-name column inside the spectrum table itself: the column populates only when the gate is met, and stays blank otherwise. That blank entry is doing real work. It is the mechanism that prevents over-naming.
Run the gating rule on your own spectrum
Open a free FractalCycles analysis on any symbol, then walk through the cycle spectrum row by row using the conversion table above. The named-cycle test takes under thirty seconds.
Run a free analysis NowThree worked examples
These are real captures from FractalCycles, default settings, 600 bars used. The mappings below come straight from the spectrum tables, with the gating rule applied row by row. Each example leads with the dominant cycle, the row carrying the brightest orange strength-rank dot, then walks the rest of the top 7 by Fit.
Example 1: ^GSPC Daily
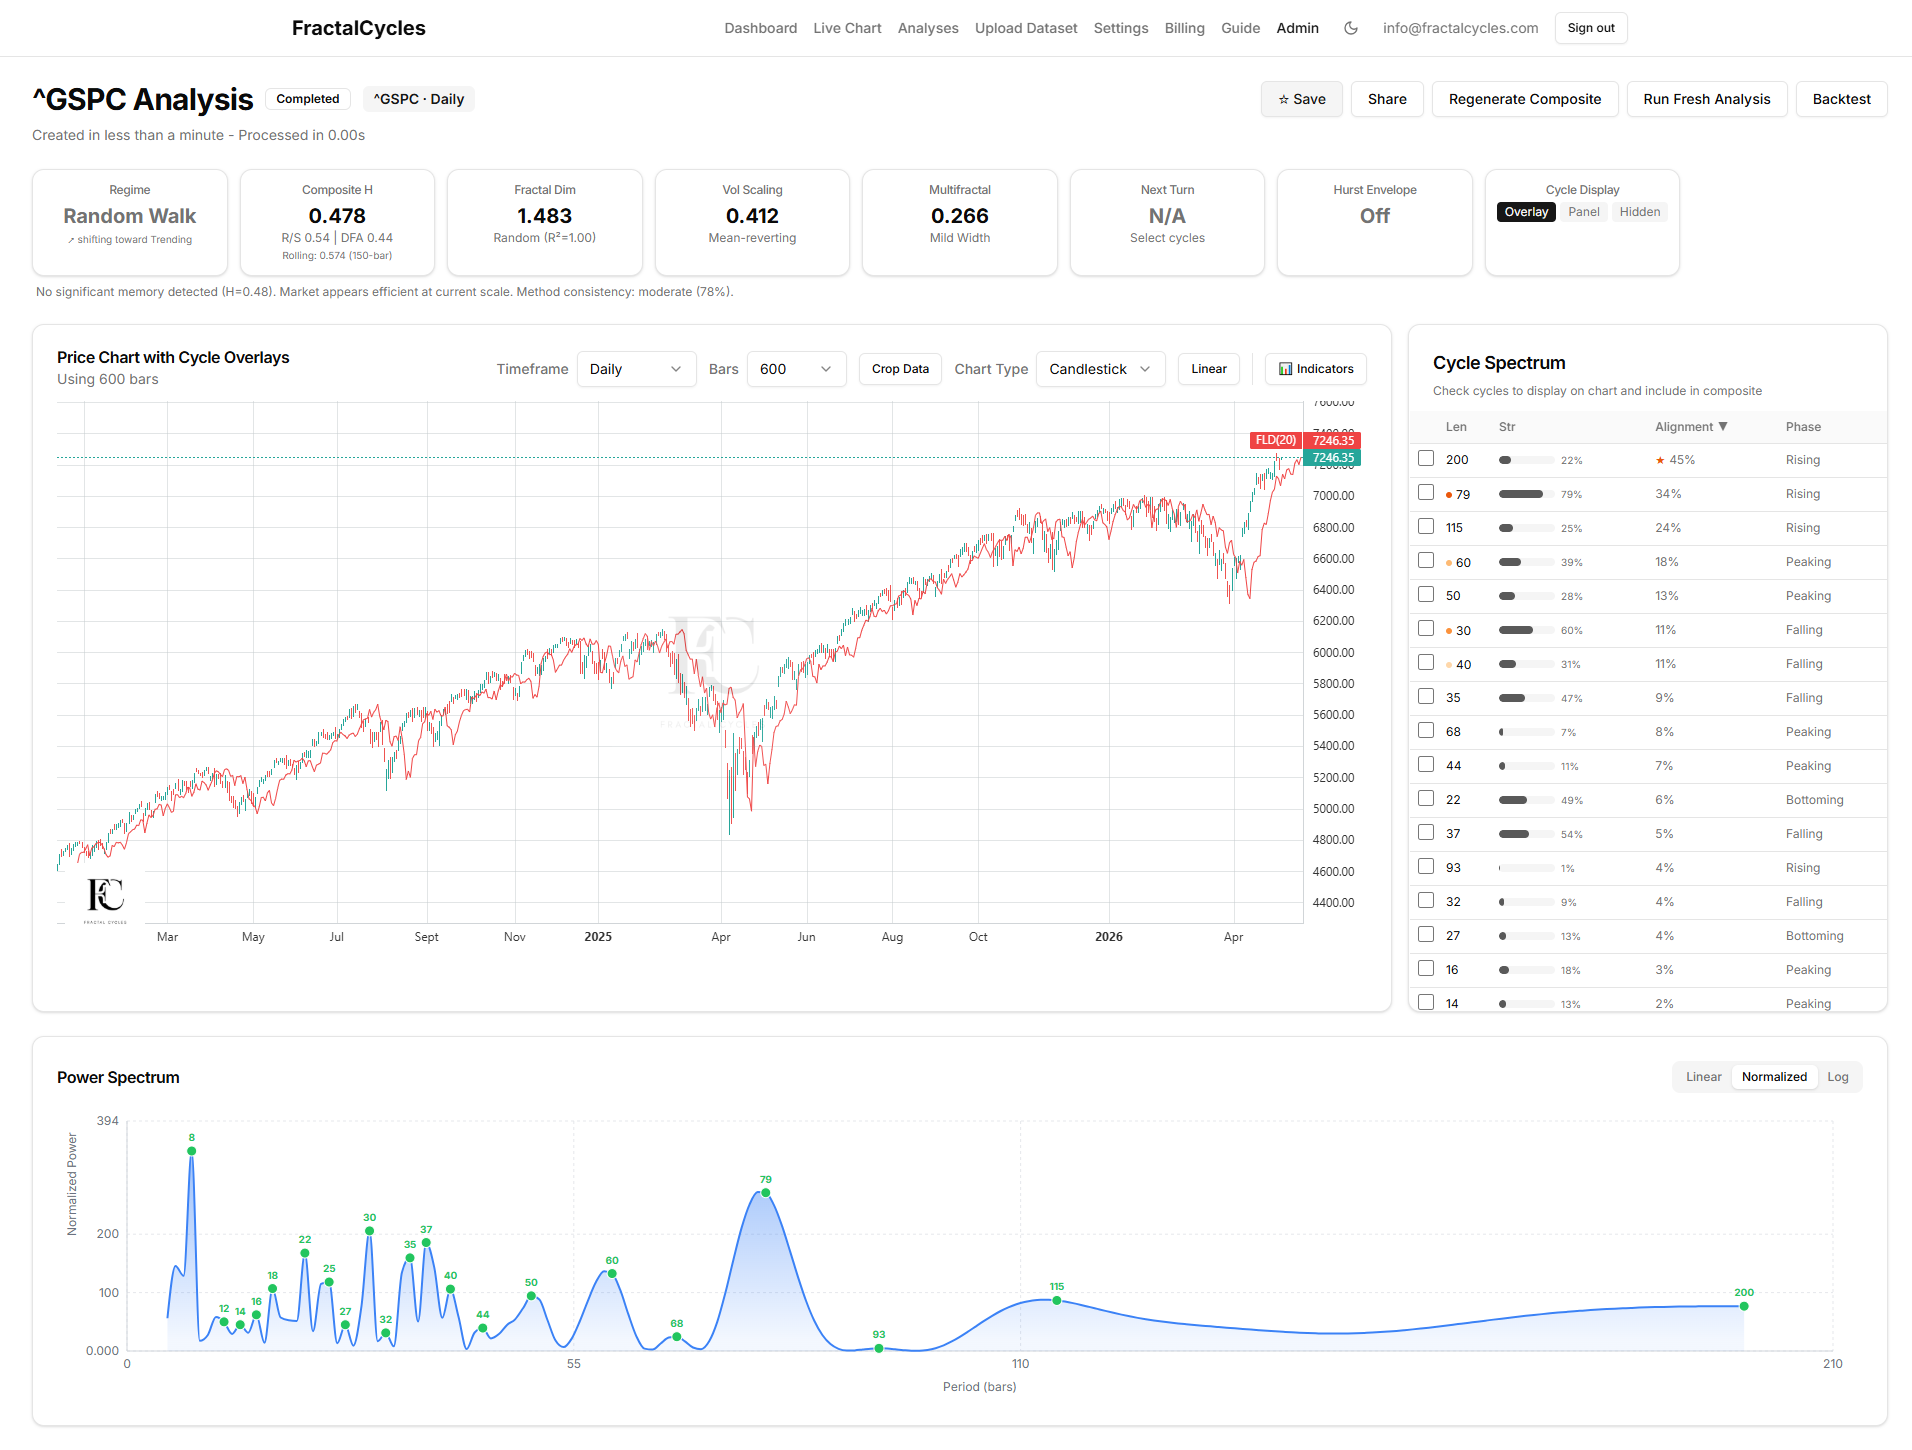
Start with the dominant cycle. Period 79 carries strength 79%, the brightest orange strength-rank dot in the analysis, and sits inside the top 7 by Fit. It is the loudest, most persistent rhythm in the window. But 79 trading bars converts to roughly 111 calendar days, which sits in the gap between the 80-day (68.2) and the 20-week (136.4) buckets. From 80-day it is +63% off, from 20-week it is -19% off. Outside the tolerance band of either nominal. The orange dot tells you FractalCycles has identified a strong, persistent rhythm at that wavelength. The gating rule tells you it is not a Hurst nominal. Real, unnamed background structure.
Now look at row 1. Period 200 on a daily equities chart converts to roughly 280 calendar days (200 × 7/5). The 40-week nominal expects 272.8 calendar days. Detected divided by expected is +2.6%, deep inside the tolerance band. Top of the spectrum by Alignment, top 7 by Fit. The label sticks. 40-week.
Drop to row 5. Period 50 on a daily equities chart converts to roughly 70 calendar days. The 80-day nominal expects 68.2 calendar days. Detected divided by expected is +2.6%, again deep inside tolerance. Top 7 by Fit. The label sticks. 80-day.
Three top-7 cycles, two cleanly named (40-week, 80-day), one loud-but-unnamed (the dominant period 79). The discipline of the gating rule lets the dominant cycle stay nameless without dimming the analysis. It is real. It is just not in Hurst's eleven buckets.
Example 2: BTC-USD 1 Hour
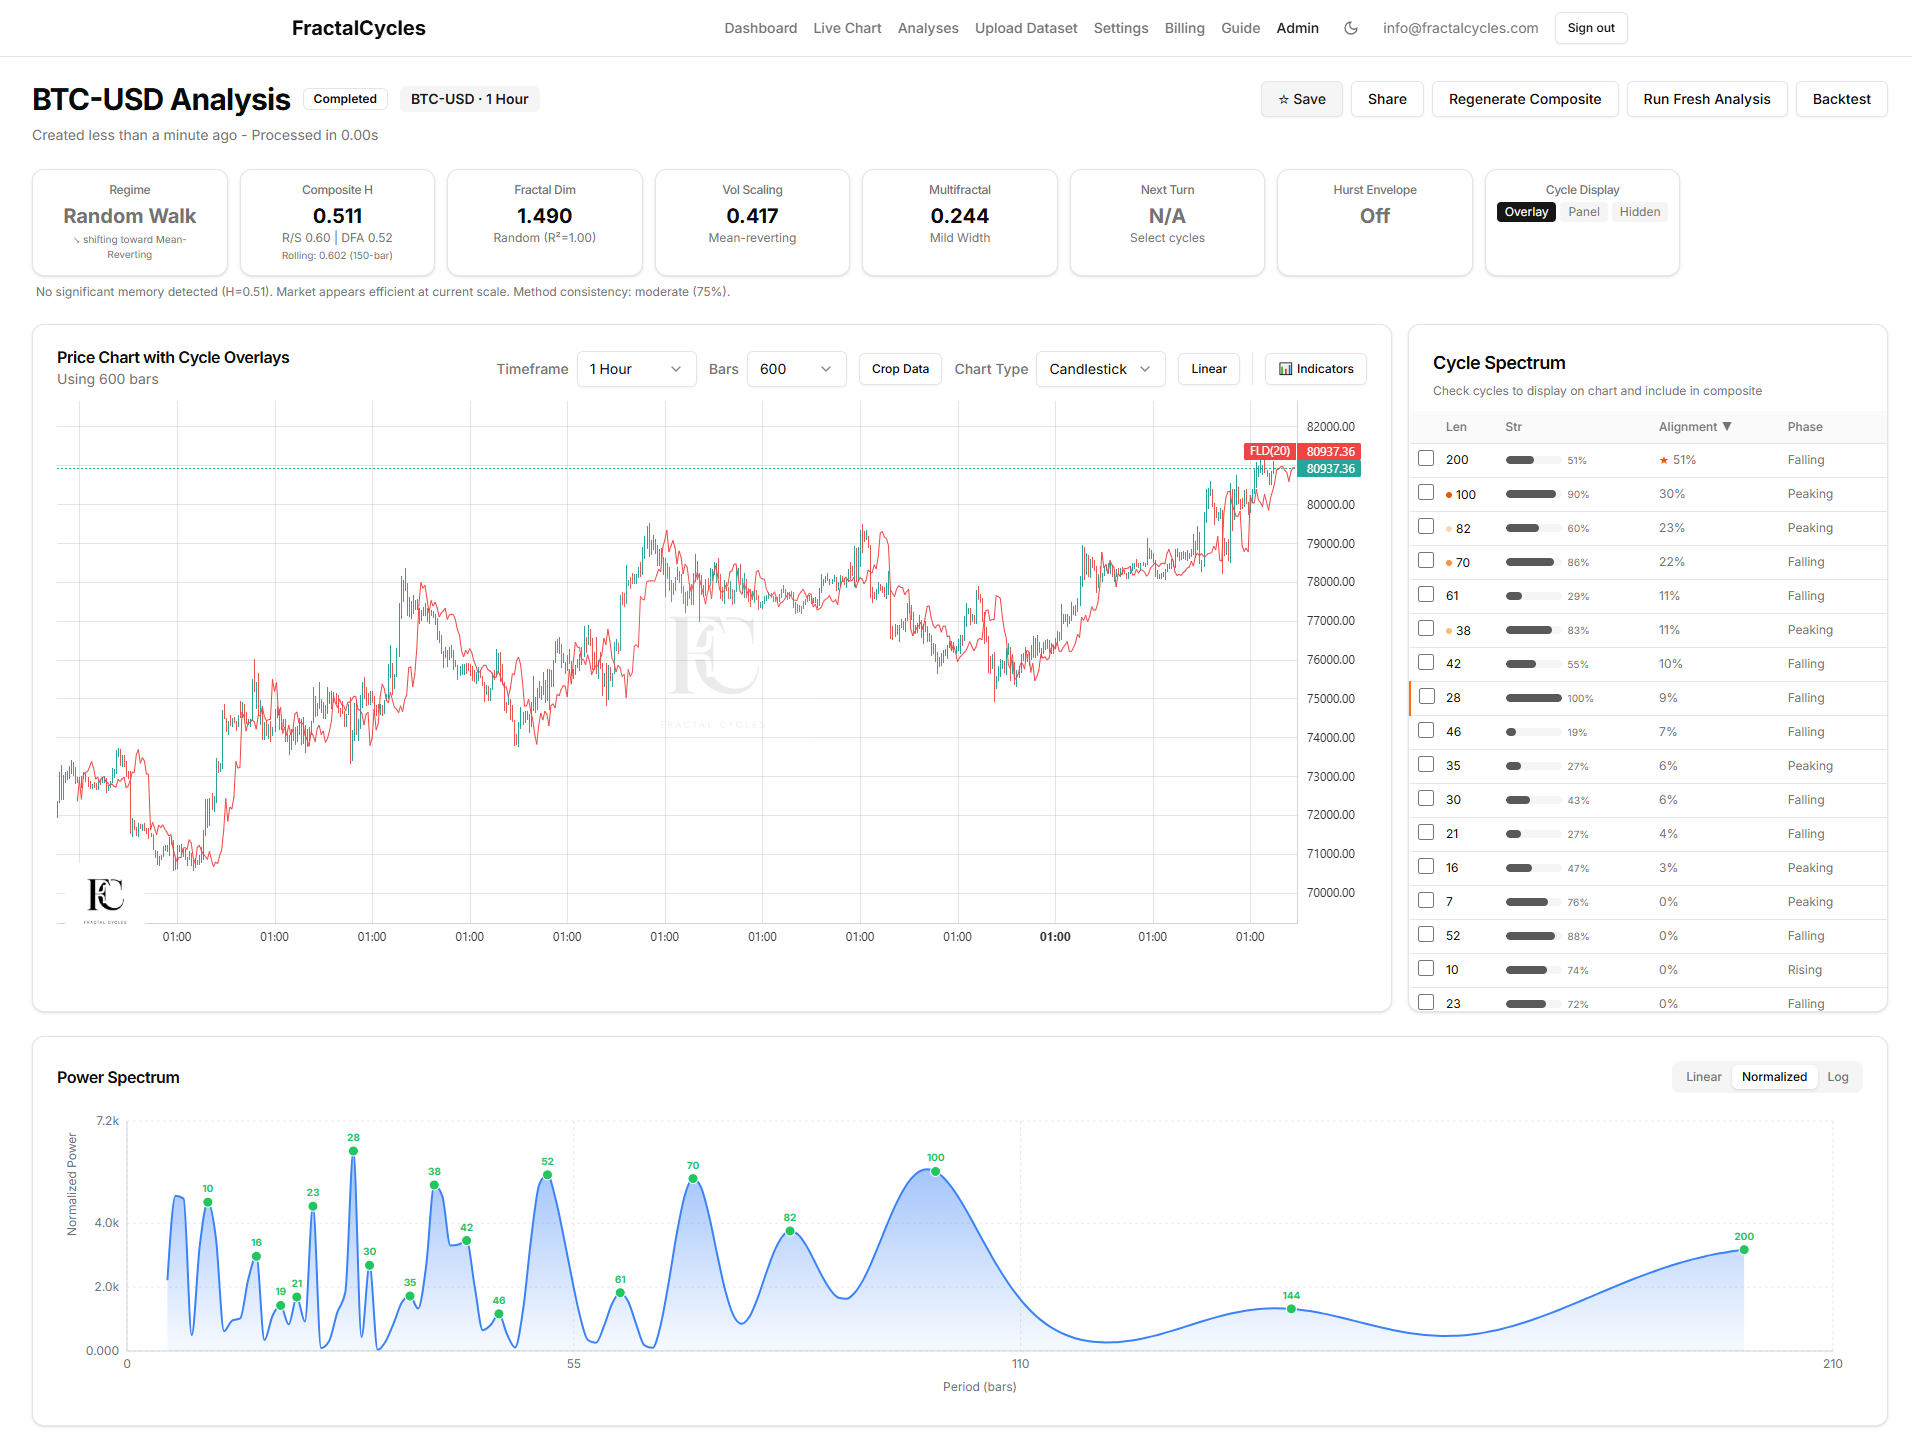
The dominant cycle here is period 100. Strength 90%, the brightest orange dot in the spectrum, top 7 by Fit. On 1H BTC, 100 bars is 100 hours, which is 4.2 calendar days. The 5-day nominal expects 4.3 calendar days. Detected divided by expected is -3.0%. Inside tolerance. The label sticks. 5-day.
Row 1 then lights up the harmonicity principle. Period 200 carries the highest Alignment in the spectrum and is also a clean Hurst hit: 200 hours is 8.3 calendar days, the 10-day nominal expects 8.5 calendar days, -2.0% off. Inside tolerance, top 7 by Fit. 10-day. The dominant 5-day and the top-Alignment 10-day cycle sit in the same window in a clean 2:1 ratio. This is exactly what Hurst's harmonicity principle predicts. When a nominal candidate appears alongside its half-and-double partners, conviction rises sharply.
The remaining loud rows in this analysis (period 82 at strength 60%, period 70 at strength 86%, period 38 at strength 83%) sit below the Hurst floor of 5 days. They are sub-nominal. In Hurst's intraday extension of the model (Cyclitec Course) the cycle list pushes lower (2.5-day, 30-hour and below), but the eleven-bucket end-of-day list stops at 5 days. Same gating discipline applies. Loud is not the same as named.
Example 3: ^GSPC Weekly
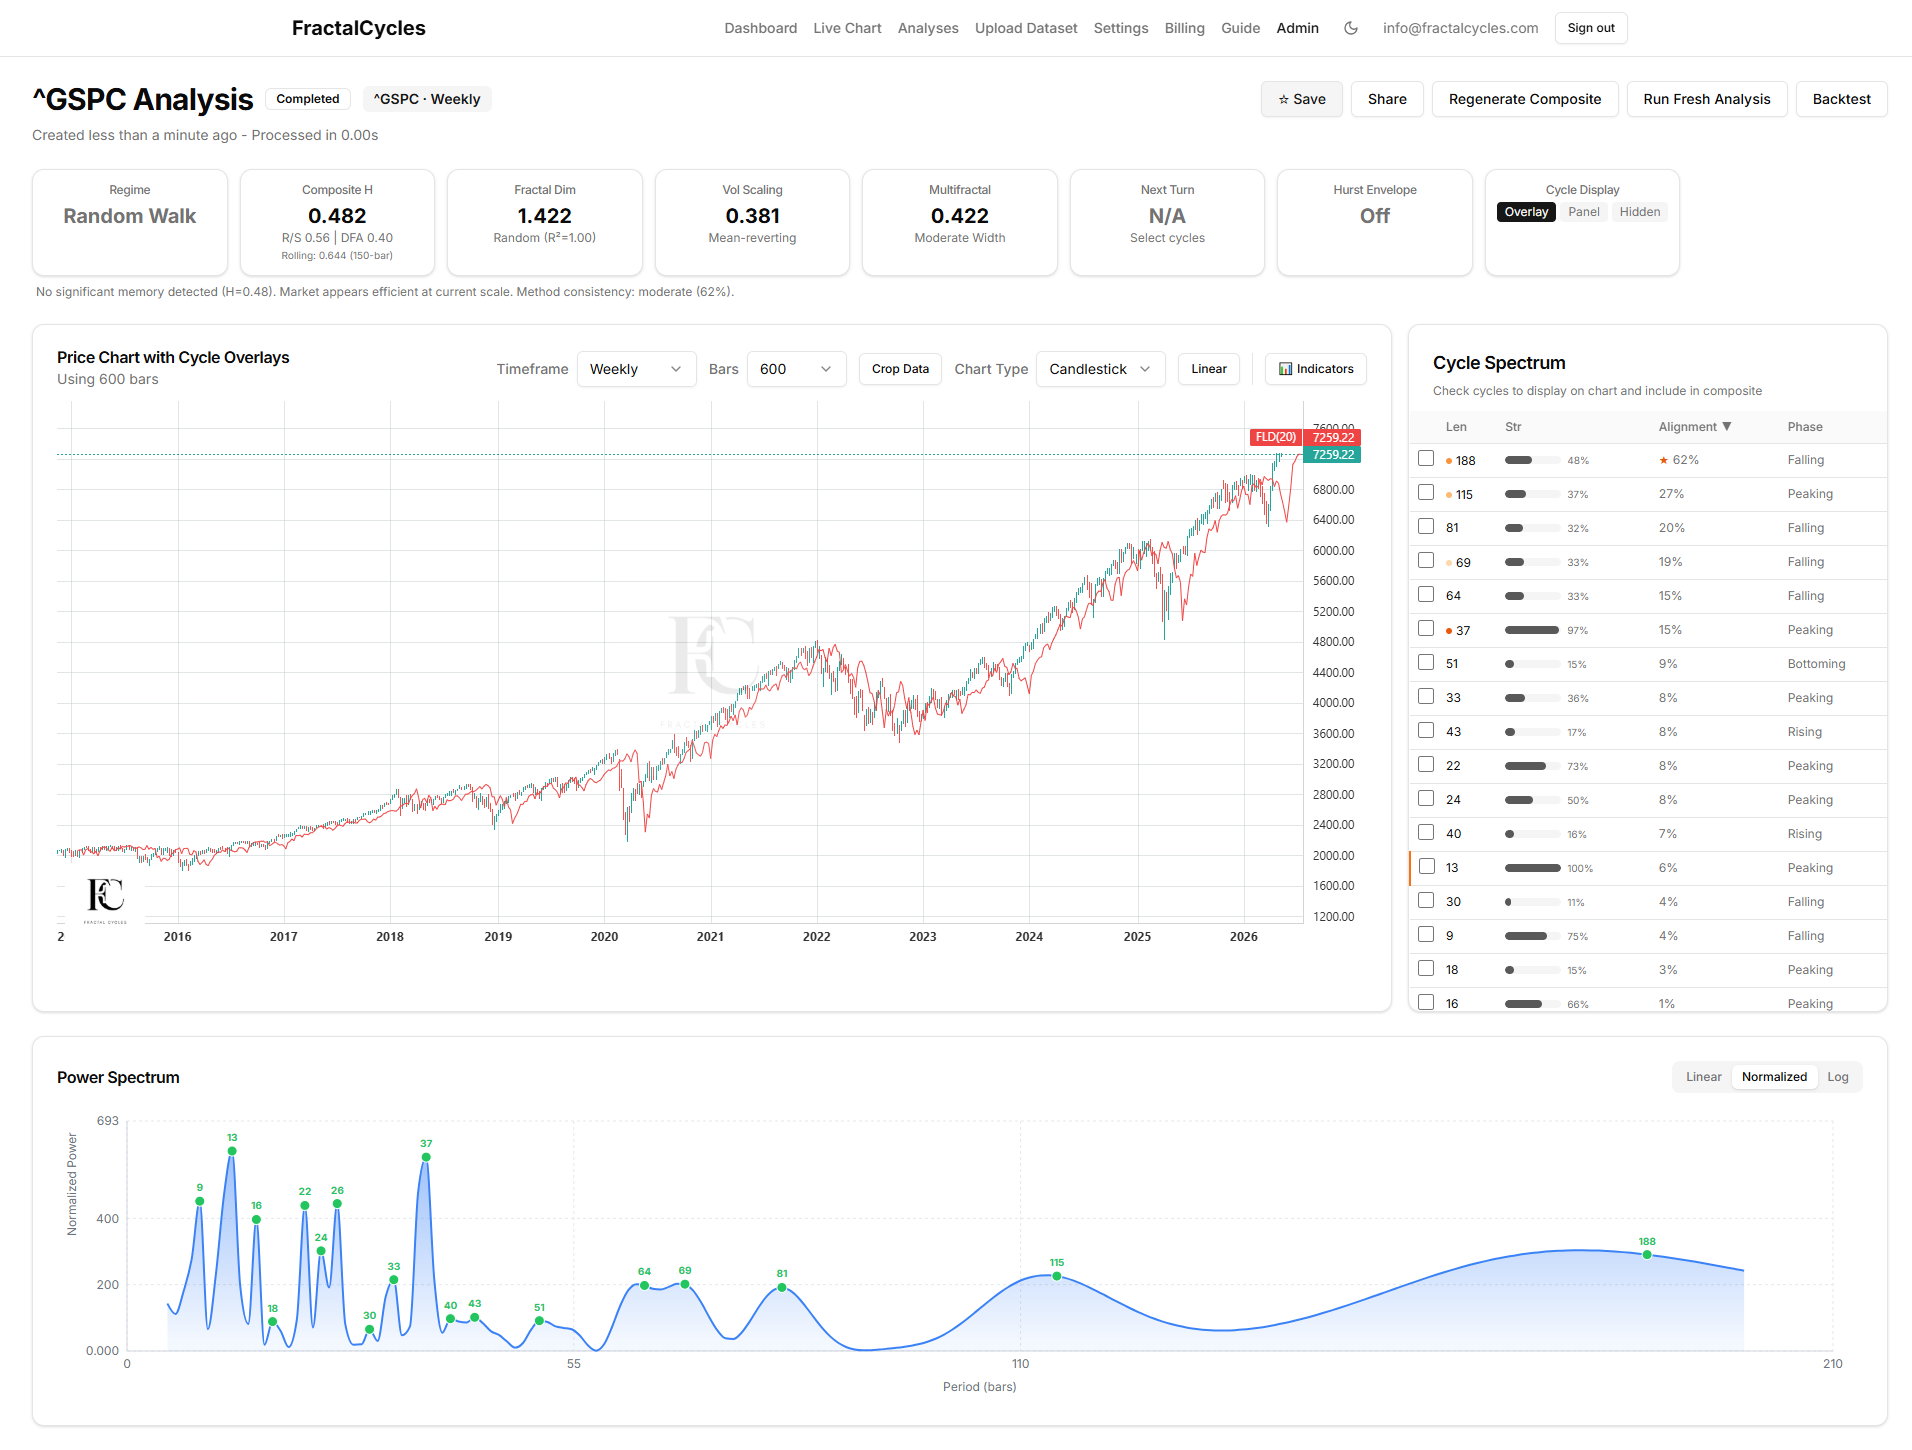
This one is the most instructive of the three because the brightest cycle in the spectrum earns no Hurst label at all. Row 1 is period 188, with the highest Alignment in the analysis. On a weekly chart, 188 bars is 1,316 calendar days, roughly 3.6 years. That falls between the 18-month nominal (545.6 calendar days) and the 54-month nominal (1,636.8 calendar days), outside the tolerance band of either. This is Kitchin business-cycle territory, not Hurst-nominal territory. The gating rule says: blank.
Read that again. The brightest, most prominent cycle in the spectrum carries no Hurst label. The whole point of the gating rule is to allow this honest answer. Most spectra have rows that earn no Hurst name, and most have rows that the gating rule keeps blank even when they look loud. Discipline, not pattern-matching.
Row 3 is period 81, which on a weekly chart is 567 calendar days. The 18-month nominal expects 545.6, +3.9% off. Top 7 by Fit. 18-month. Row 6 is period 37, which on a weekly chart is 259 calendar days. The 40-week nominal expects 272.8, -5.1% off. The brightest orange dot in the spectrum, strength 97%. 40-week.
Two clean labels (18-month, 40-week), one prominent unnamed cycle (the 3.6-year Kitchin), and a clear lesson about the discipline of the gate.
Harmonics: why nominal cycles travel together
The harmonicity principle has practical consequences for how you read a spectrum. If the 80-day nominal is genuinely active in your data, you should find the 40-day and the 20-day in the same analysis, all sitting in the rough 2:1 ladder. If you only find the 80-day, with no neighbour at half its wavelength and no neighbour at twice it, the lone hit is more likely a coincidence and less likely a real bucket.
The BTC 1H capture above shows this directly. The 10-day and the 5-day appear in the same spectrum, both inside tolerance, both top of the rankings, sitting in the predicted 2:1 relationship. That is a clean harmonic family signature. The S&P 500 daily capture shows a partial version: the 80-day and the 40-week (which is roughly 4x the 80-day, or two doubling steps) both clear the gate, while the intermediate 20-week candidate (period 115) is just outside tolerance. Partial families are common. Complete families are rare and worth flagging.
Honest framing: Hurst observed harmonicity on equities, in the era and instruments he studied. The principle holds often enough across asset classes to be useful as a guide. It does not hold universally. The academic spectral-analysis literature has not endorsed the 2:1 ladder as a general property of financial time series, and the more cautious reading is that harmonicity is a working hypothesis to test per-instrument rather than a theorem to assume. For the falsifiability framing on this point see Granger's classic result on the typical spectral shape of an economic variable (Granger, Econometrica 34(1), 1966, accessed 2026-05-06). Most economic series have smooth declining spectra with no narrow peaks, and any narrow peak deserves scrutiny. The harmonic family check is one such scrutiny. When the family is intact, conviction rises. When you only see one bucket alone, treat it carefully.
What to do next
Open your favourite instrument, run an analysis, and walk through the spectrum row by row using the conversion table above. For each row, ask three questions: did this period clear the prominence gate (top 7 by Fit or orange dot)? does it sit inside plus-or-minus 10 to 15 percent of one of the eleven nominals on this timeframe column? do its harmonic neighbours show up as well? If the answer to all three is yes, you have a Hurst-named cycle in your spectrum. If not, treat it as significant but unnamed background structure, which is what the gate is designed to flag.
For deeper background on the principles behind the conversion table, see understanding market cycles. For the long-memory statistic that lives in the regime-detection part of the platform (and is named after a different person, as covered earlier), see the Hurst exponent guide. For a current cross-asset read on where the 80-day cycle sits across 22 markets in May 2026, see the companion piece on the 80-day cycle right now. For the S&P 500 in particular, see the S&P 500 cycles analysis page.
The Hurst-nominal label for any detected cycle equals the conversion-table calendar wavelength that matches your bar duration multiplied by the detected period count, gated by three checks: Bartels-passed (entry), top 7 by Fit or orange strength-rank dot (prominence), and inside the ±10-15% tolerance band of one of the eleven nominals (5-day, 10-day, 20-day, 40-day, 80-day, 20-week, 40-week, 18-month, 54-month, 9-year, 18-year).
Period numbers are not portable across timeframes. The Hurst label is. A cycle of period 200 is a 40-week nominal on a daily equities chart and a 10-day nominal on a 1-hour BTC chart, because the bar duration covers a different fraction of the calendar wavelength.
The dominant cycle in your spectrum, the one with the brightest orange strength-rank dot, is often not a Hurst nominal. That is normal, and the gating rule is designed to leave it unnamed. Loud is not the same as named.