Blog
Insights on market cycle analysis, trading strategies, and the science of pattern recognition.
When Will Bitcoin Bottom? What the Last 3 Halvings Reveal
In each of the last three halving cycles, Bitcoin's lowest close came 513 to 542 days before the next halving, about 17 months. The tops wandered by 175 days while the lows stayed within 29, and the next window runs from 15 October to 17 November 2026.
Read the article →OCT 8, 2026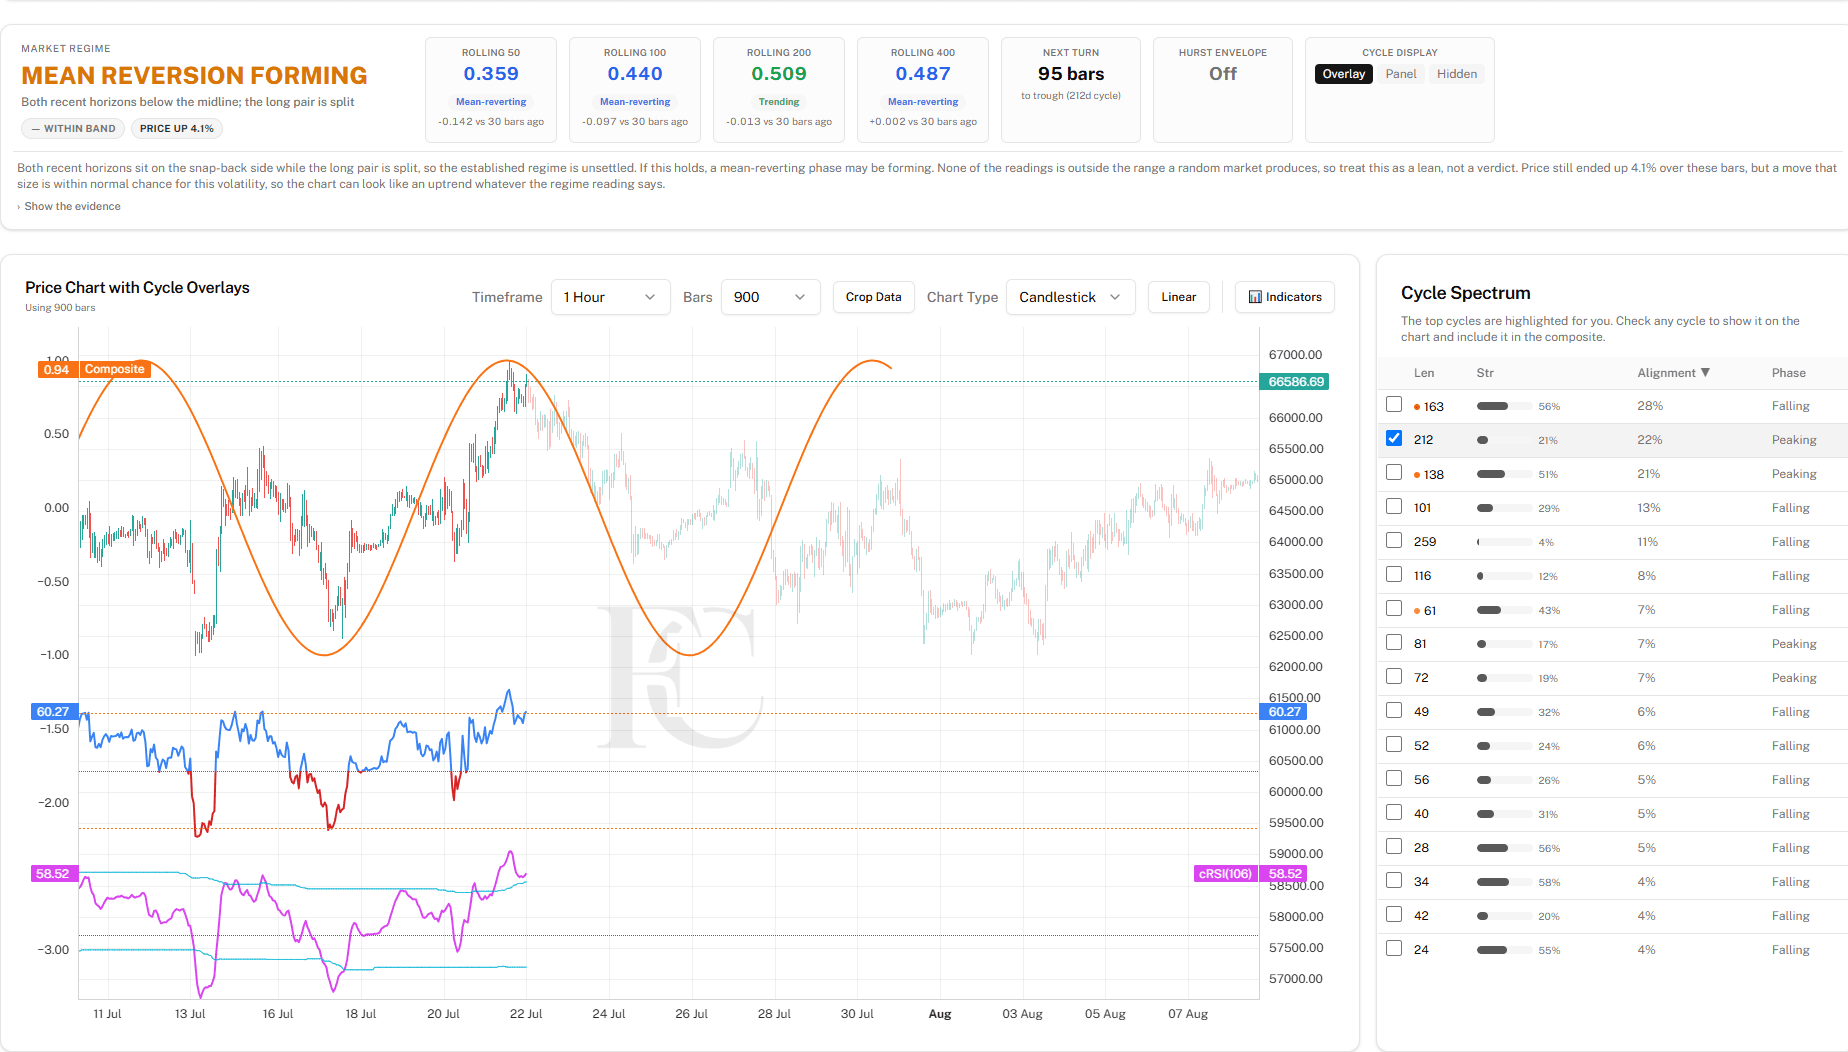 Tutorials
How I Pick the Right Cycle Period/Wavelength
The Cycle Spectrum shows 15 to 25 detected cycles, and they cannot all matter. Here is the exact 3 step method I use to find the one steering price: wait for an RSI extreme, confirm the stretch with the Market Regime reading, then select the bottoming cycle that is in phase with that extreme, favouring the longer wavelength or the higher strength.
AUG 25, 2026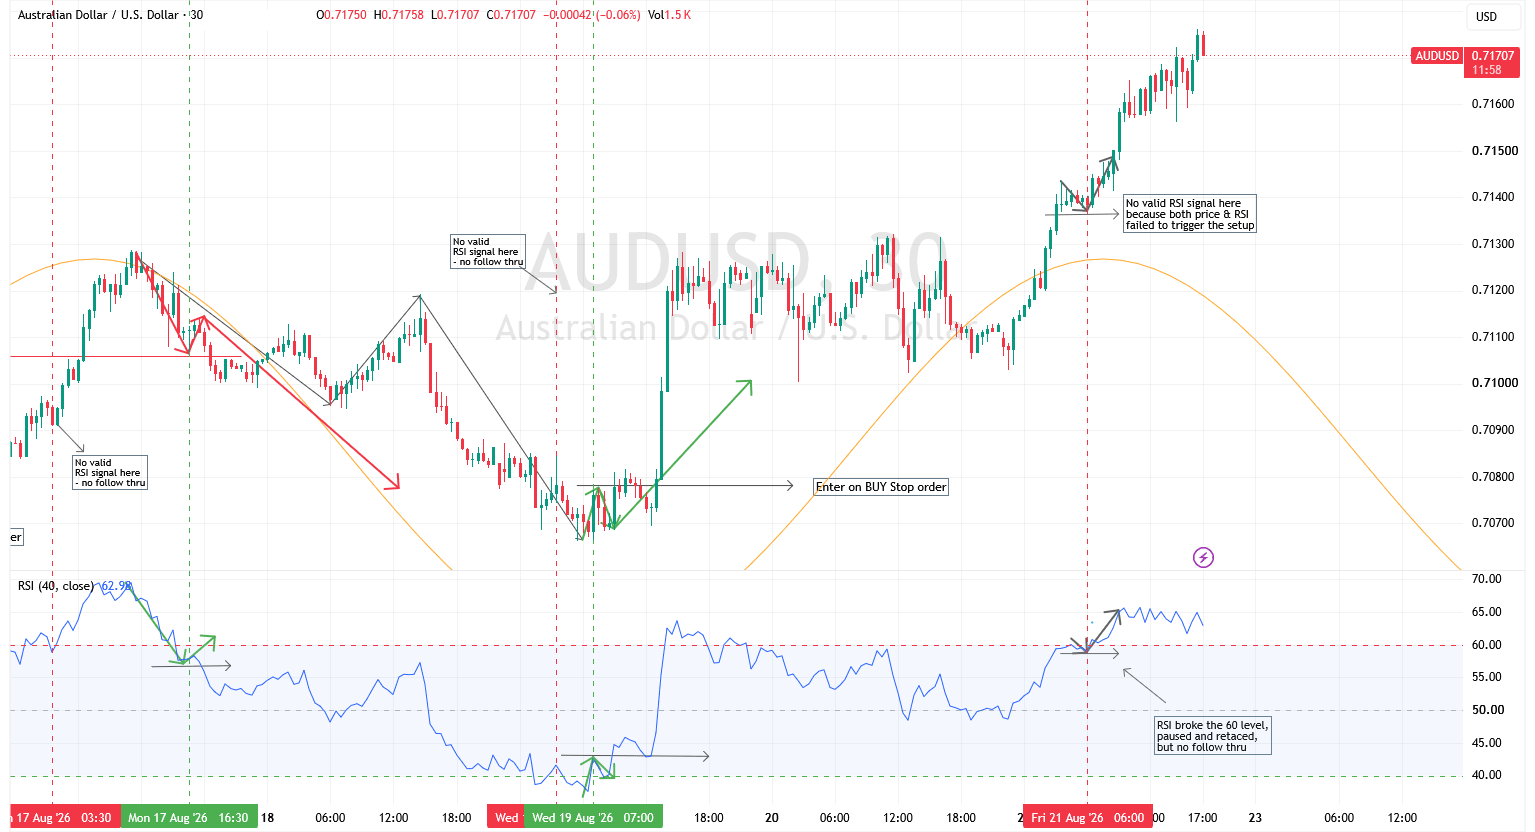 Tutorials
Cycle Analysis Finds the Window. Confirmation Finds the Trade.
The cycle projection marked another peak window on AUDUSD, RSI broke 60, and then the follow-through never came. The trade was never valid, and AUDUSD rallied anyway. Here is why that does not change the decision.
AUG 21, 2026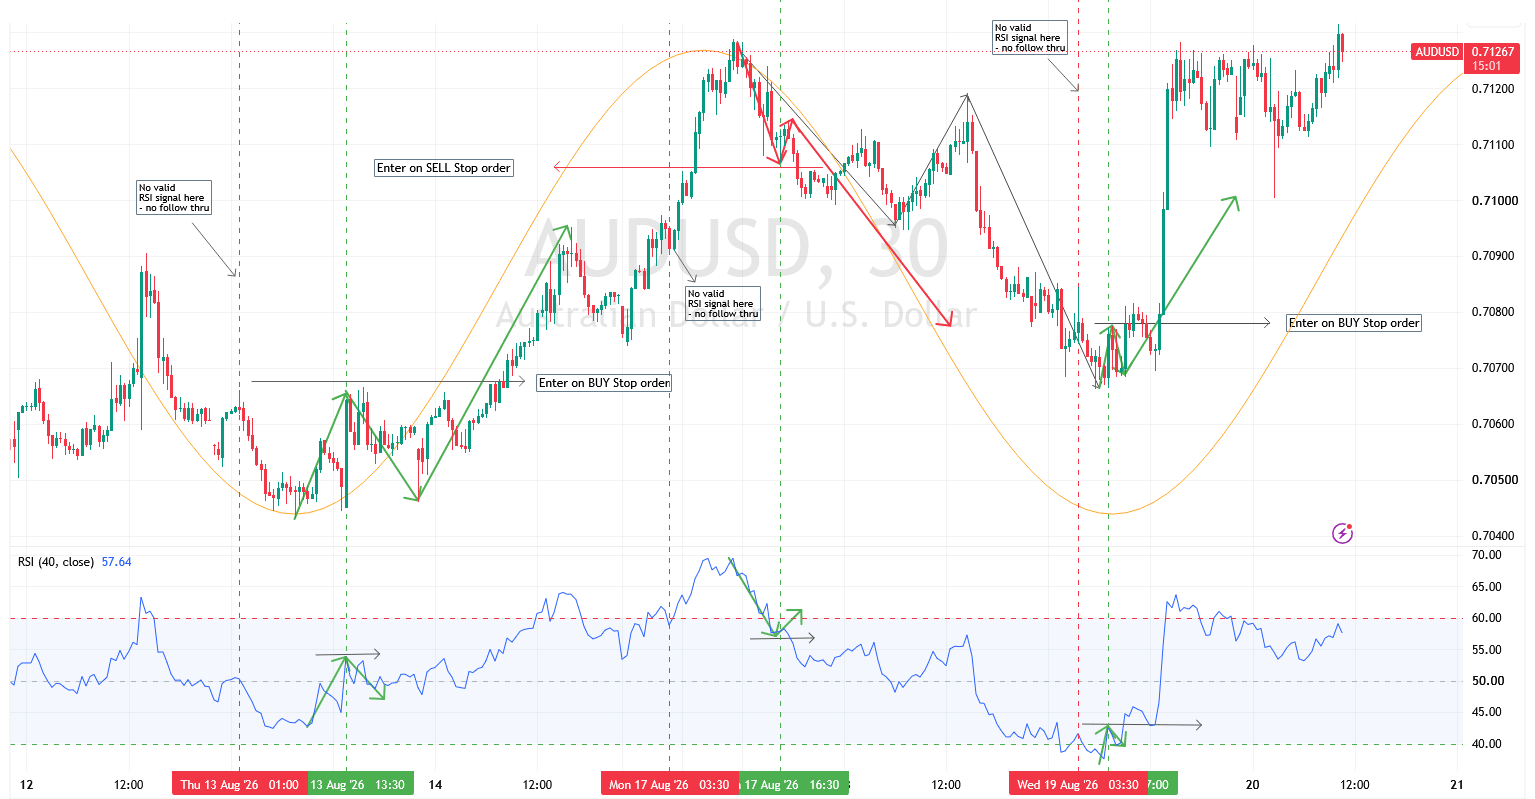 Tutorials
How I Use RSI to Confirm Cycle Analysis Entries
Many cycle analysts try to trade every projected top and bottom with no technical filter. Here is the RSI(40) structure I need to see before a FractalCycles turn becomes an entry, on a real AUDUSD 30-minute chart.
AUG 21, 2026Is This Market Actually Trending? A Field Guide to Reading Persistence
A market with no memory at all reads as high as 0.66 over 50 bars, so the popular 0.55 rule labels pure noise a trend. Why the honest threshold shrinks as data grows, and why one length outside the range fools you about a quarter of the time.
AUG 18, 2026The Contrarian's Missing Reference
Most retail market participants are already contrarian by instinct. Across 143 oversold episodes on five instruments, the first reading was the low only 21.7% of the time. What fading a move is missing is not conviction. It is a clock.
JUL 31, 2026The Hierarchy of Time: Why Multi-Timeframe Analysis Comes First in Cycle Research
Weekly before daily, 4H before 1H, 1H before 15M. Markets are a stack of nested cycles, and that structure dictates the order of analysis. The full top-down method, illustrated on live Bitcoin data across five timeframes.
JUL 29, 2026Why Your Turn Marker Missed (and the Live Analysis Didn't)
A subscriber's manually-marked turn kept missing while re-running the live analysis converged on the actual turn. Why the date shifts between runs, and when a saved screenshot is still safe to use.
JUL 4, 2026Hurst Exponent for Bitcoin: What the Data Actually Shows
Bitcoin's Hurst is 0.56 over 900 daily bars. Four methods, a rolling read across 30 monthly snapshots, and a side-by-side against SPY and gold: trending in 83% of windows, mean-reverting in zero.
MAY 15, 2026Why Most Cycle Analysis Fails (And How Statistical Validation Fixes It)
Four documented failure modes account for nearly every spurious cycle in retail trading content: Slutsky-Yule filter cycles, wavelength drift, regime mismatch, and uncorrected multiple testing. Each has a fix in the spectral-analysis literature.
MAY 15, 2026Why Static and Dynamic Cycle Analysis Both Matter
Static cycle analysis anchors structural rhythm. Dynamic analysis re-estimates period and phase each bar. See why serious analysts use both, with motion-graphic examples.
MAY 12, 2026Spotting Hurst Cycles in the Spectrum: A Conversion Table from Weekly to Intraday
A conversion table and a three-layer gating rule for matching detected periods to J.M. Hurst's eleven named cycles, on any instrument and any timeframe.
MAY 6, 2026Where Is the 80-Day Cycle Right Now? Cross-Asset May 2026 Snapshot
A daily-bar snapshot across 22 instruments asks one question: which markets show a cyclic component in the 70-90 day band J.M. Hurst named "80-day," and where are they in it.
MAY 5, 2026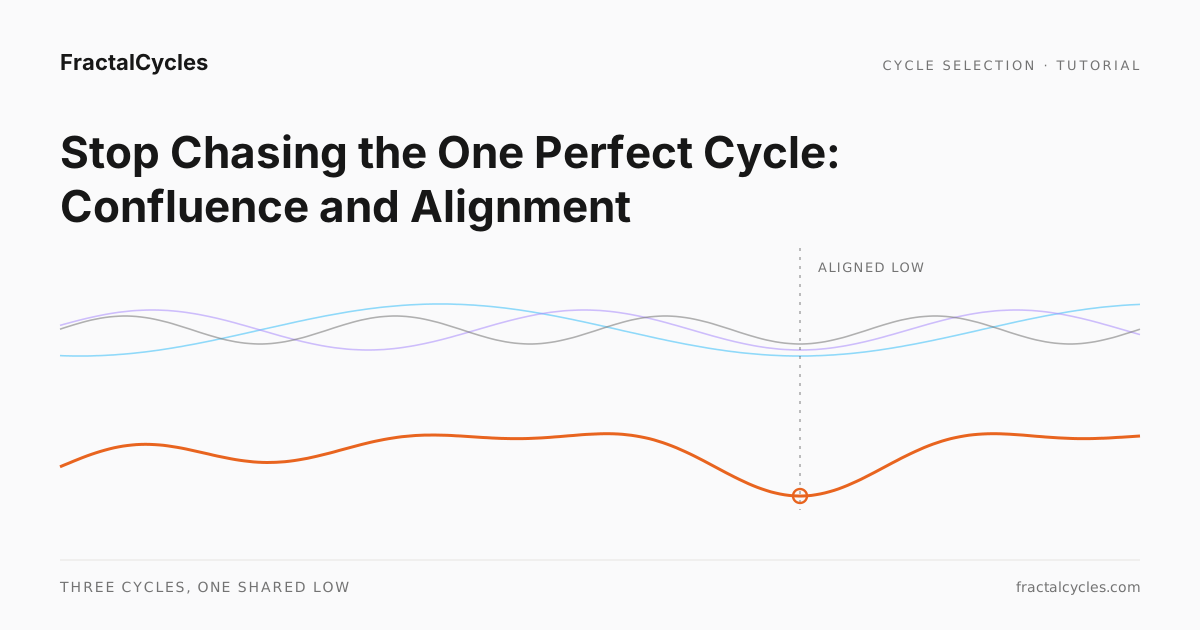 Tutorials
Stop Chasing the One Perfect Cycle: How Confluence and Alignment Changed Everything
Most traders who discover cycle analysis make the same mistake: they look for a single dominant cycle that explains everything. Here is why confluence of well-aligned cycles, confirmed by DEMA, produces far better results.
APR 3, 2026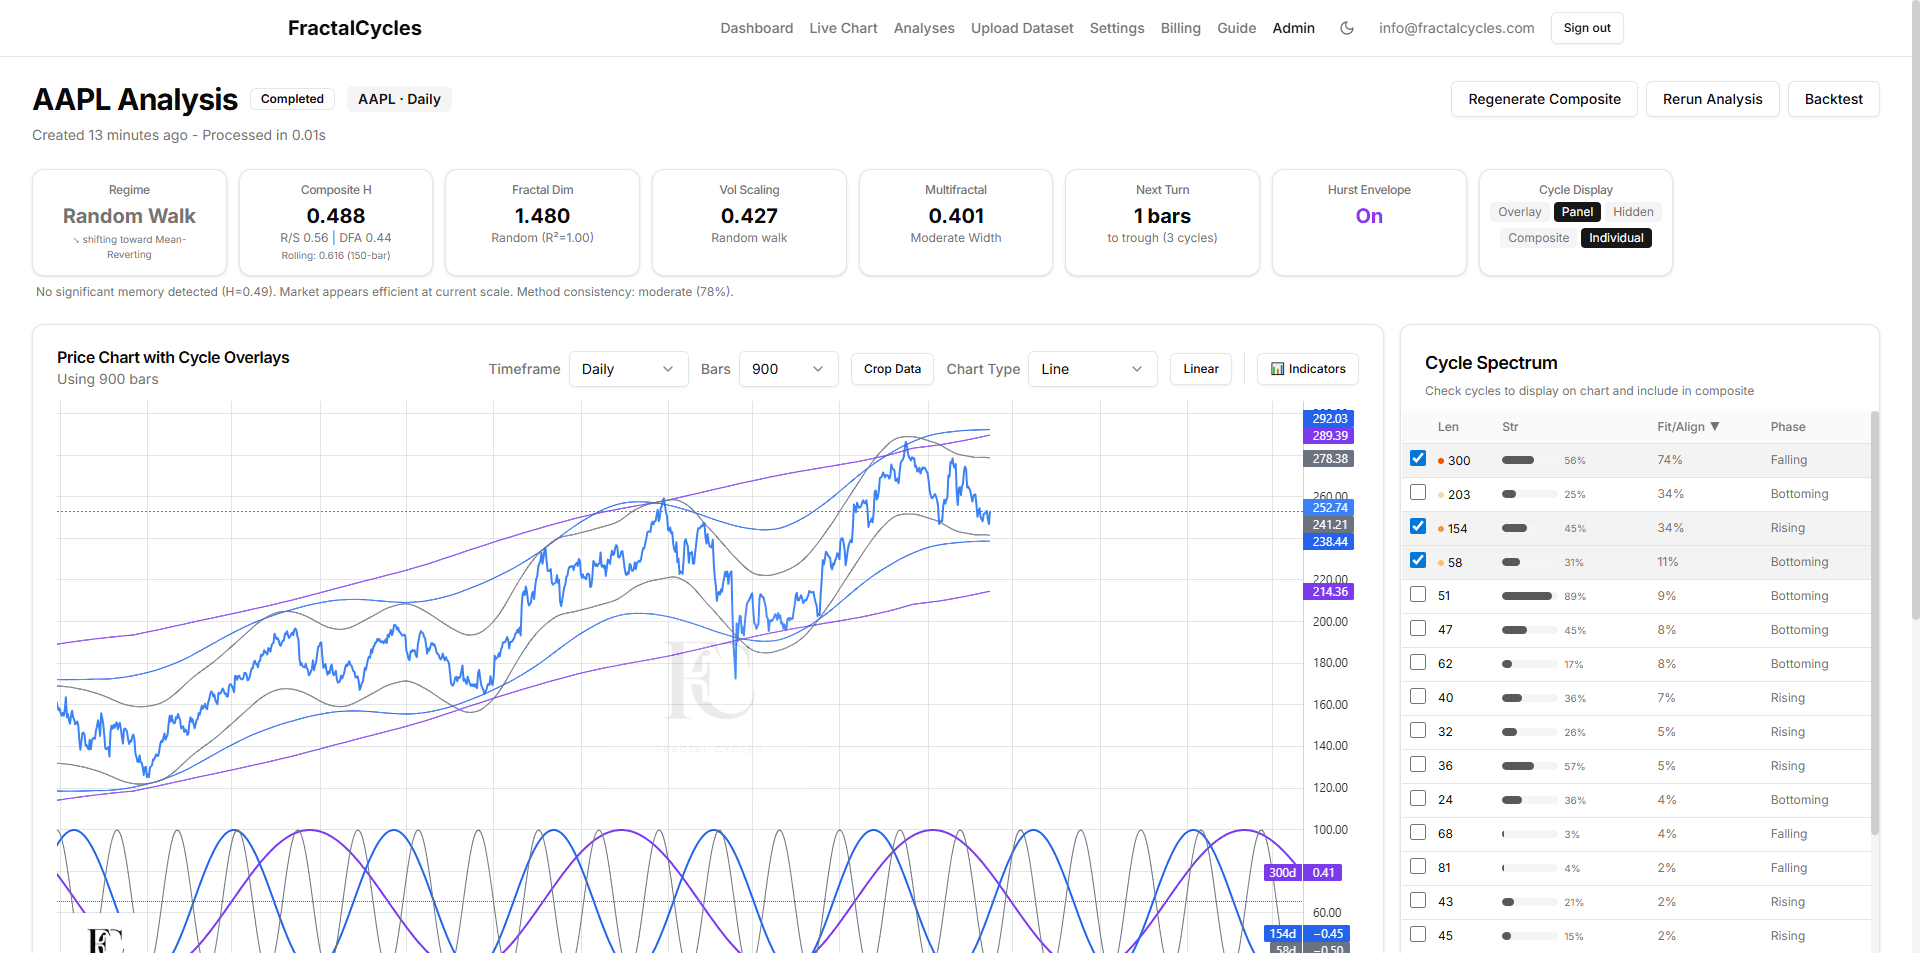 Tutorials
FractalCycles Dashboard Controls: What Every Card and Button Does
A practical walkthrough of the five key controls on the FractalCycles analysis dashboard.
MAR 31, 2026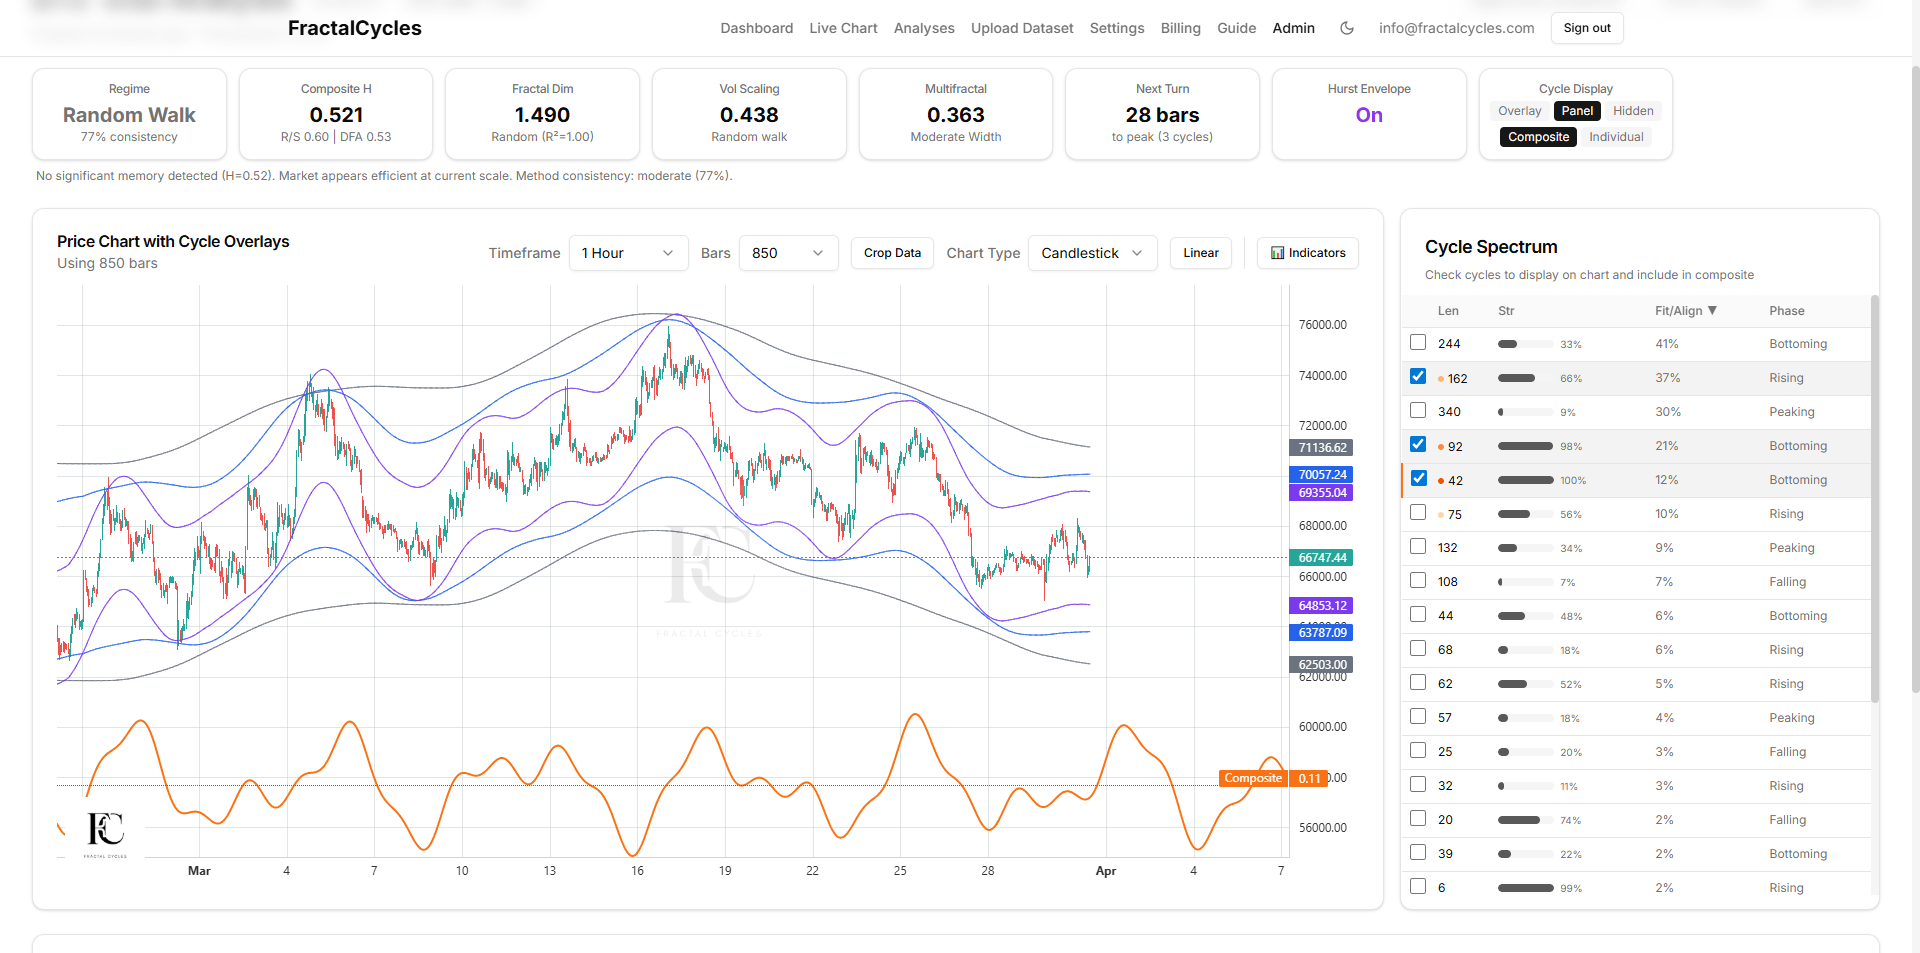 Tutorials
How to Read the Regime Dashboard
The regime cards tell you what kind of market you are in before you trade. Here is what each card measures, how they cross-validate, and what to do with the result.
MAR 31, 2026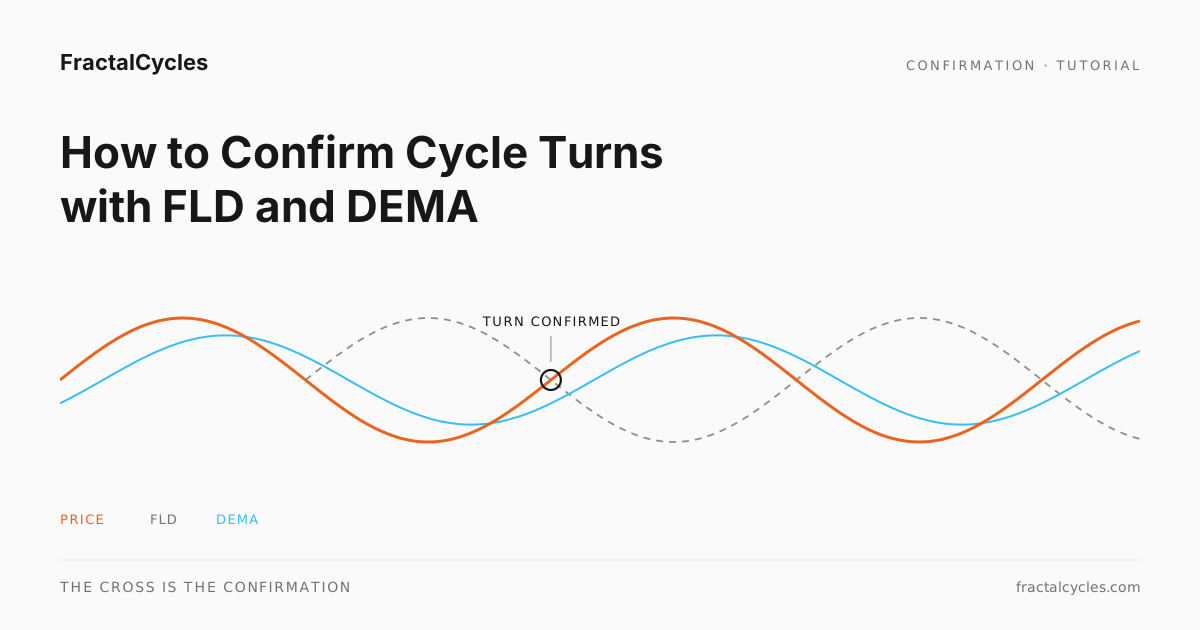 Tutorials
How to Confirm Cycle Turns with FLD and DEMA
The Hurst Envelope shows where price sits in each cycle. FLD and DEMA confirm when the turn actually happens. Here is how to add and customize both.
MAR 31, 2026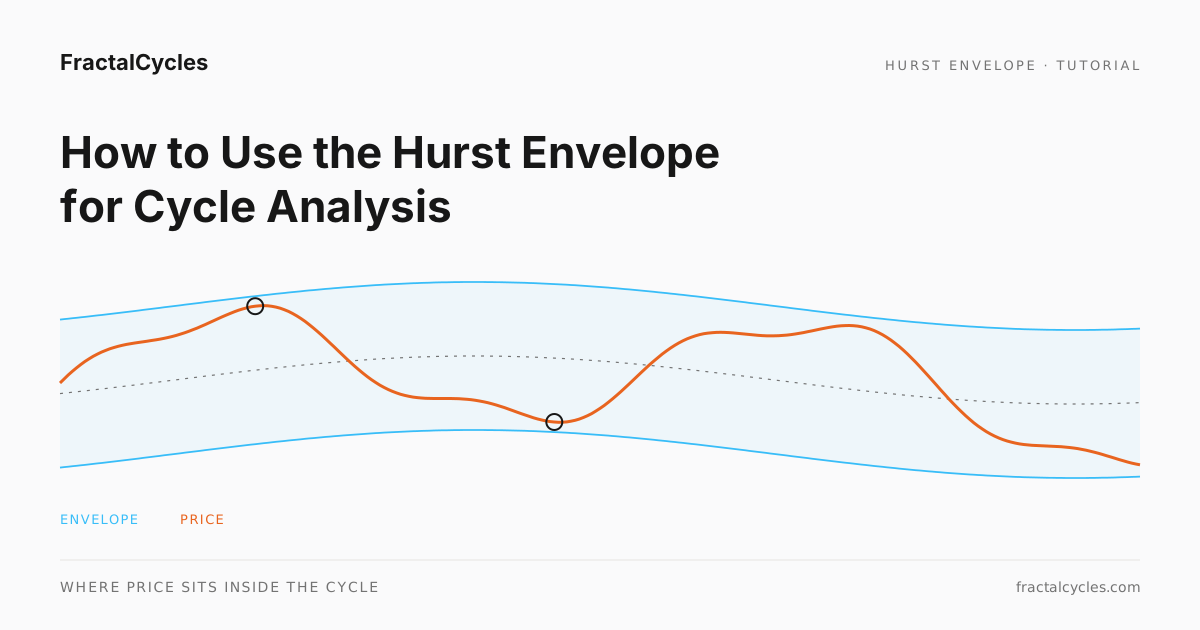 Tutorials
How to Use the Hurst Envelope for Cycle Analysis
Learn how to read the Hurst Envelope on FractalCycles. Covers the classical default method and the advanced approach using detected cycle periods from spectral analysis.
MAR 30, 2026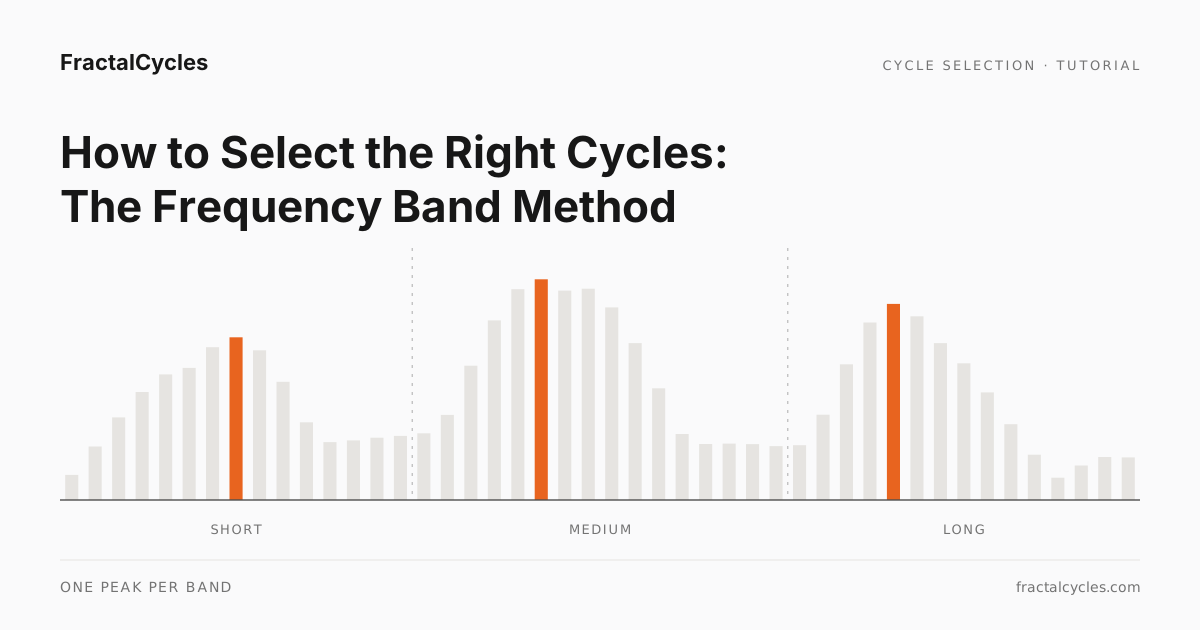 Tutorials
How to Select the Right Cycles: The Frequency Band Method
Detected cycles are only useful if you select the right ones. The Frequency Band method picks the strongest short, medium, and long-term cycle for a composite that captures structure at every timescale.
MAR 30, 2026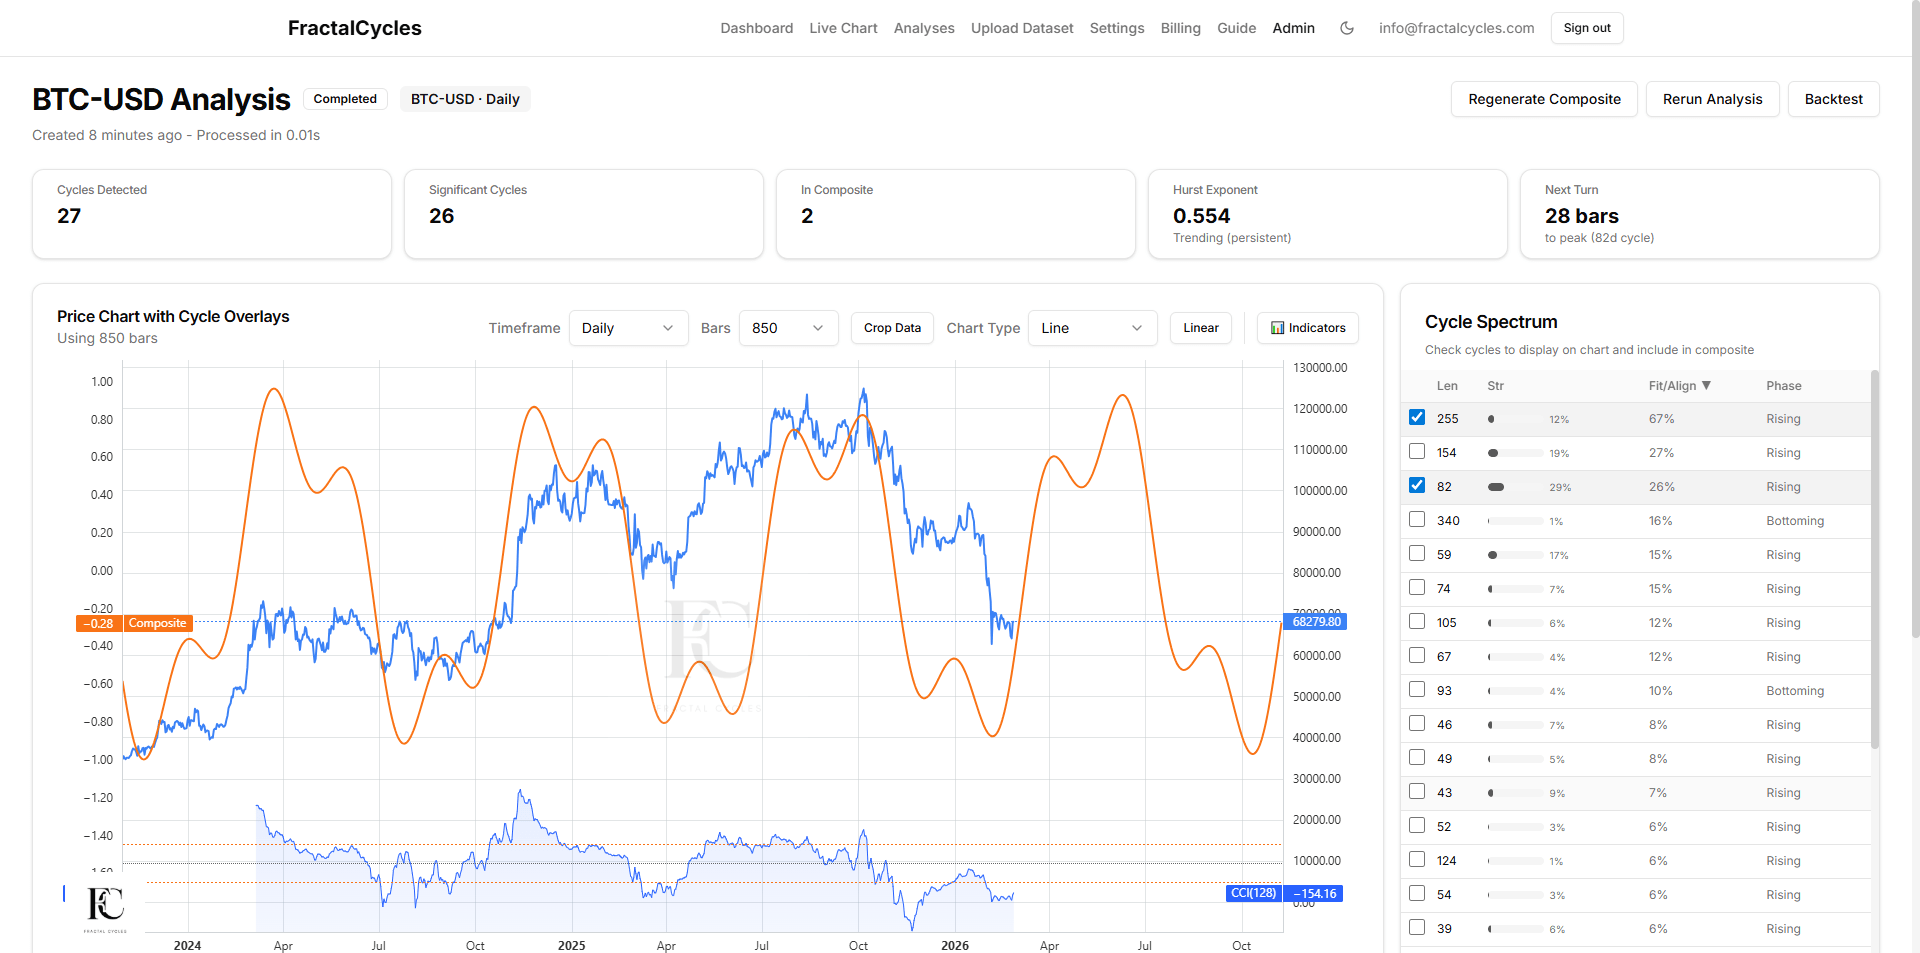 Structure Over Narrative
What If Most Technical Analysis Starts Too Late?
Most analysts react to price after it moves. But what if the structure driving that movement was already measurable? A look at Bitcoin through the lens of cycle analysis and why timing beats narrative.
FEB 26, 2026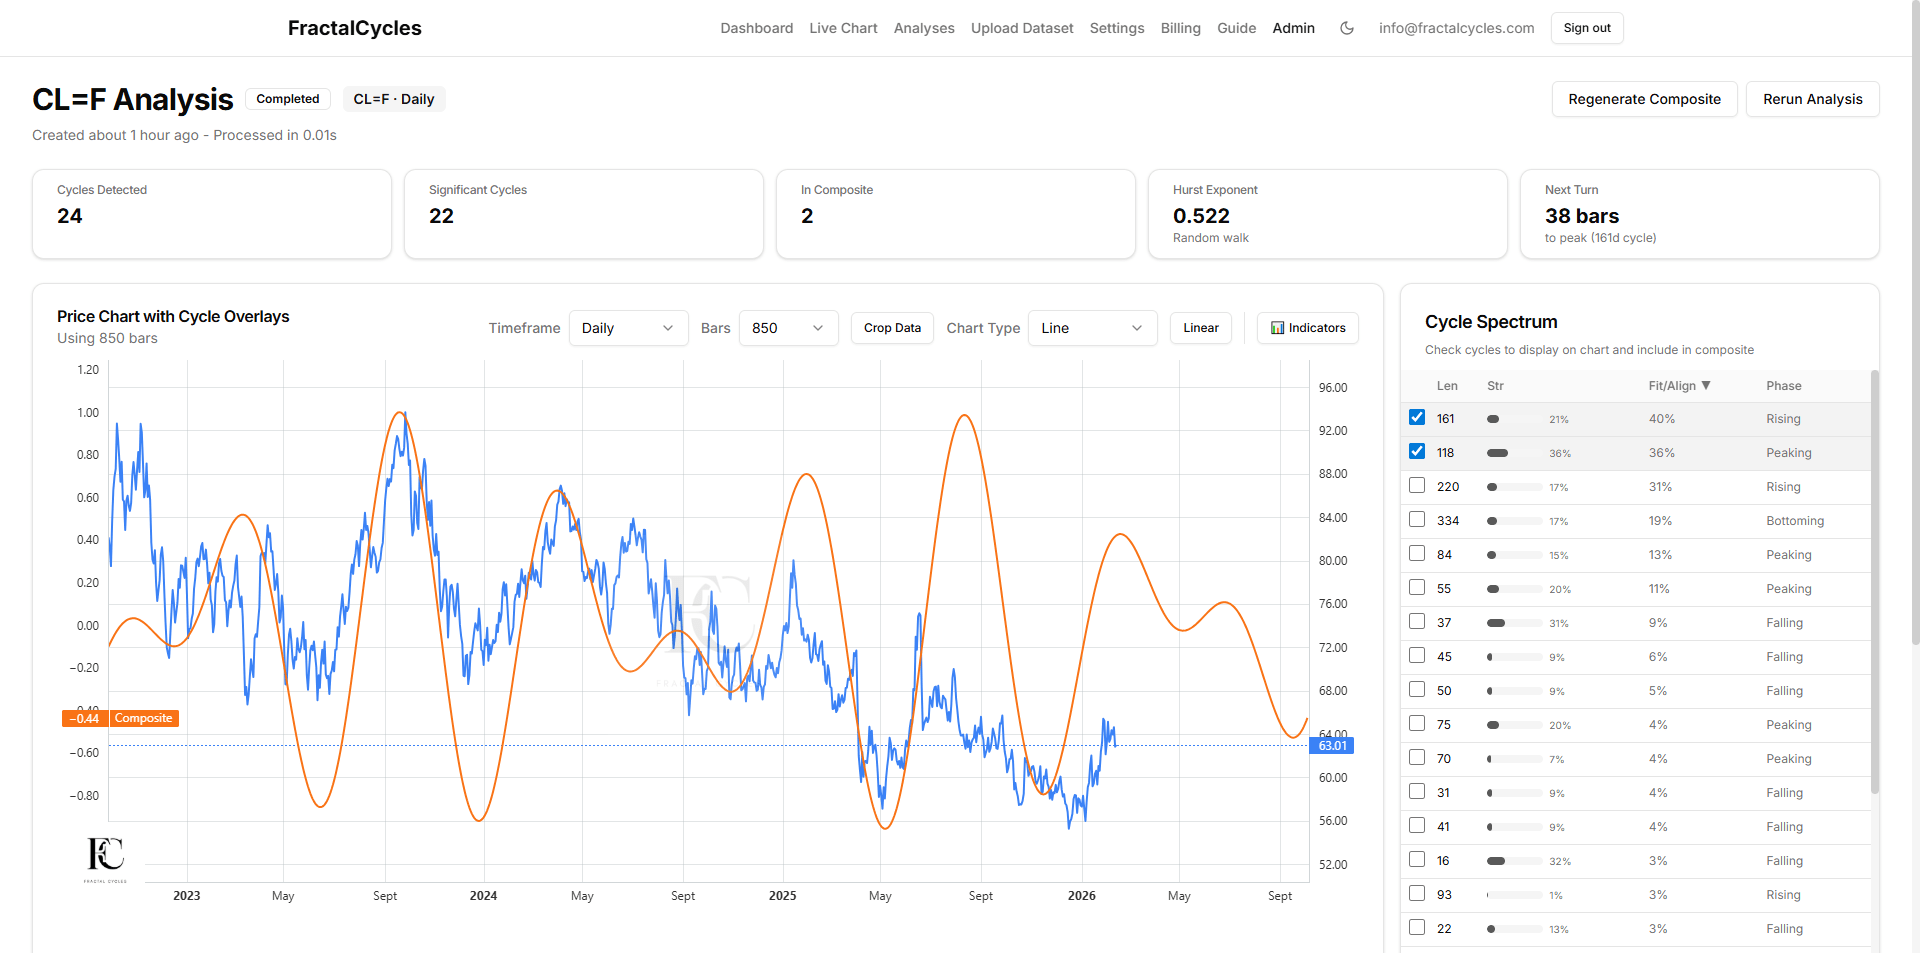 Tutorials
What Crude Oil's Cycles Look Like Right Now
We ran Crude Oil through the FractalCycles spectral analysis engine. Here is what 24 detected cycles, a Hurst exponent of 0.522, and a 2-cycle composite projection reveal about crude oil's structural rhythm.
FEB 13, 2026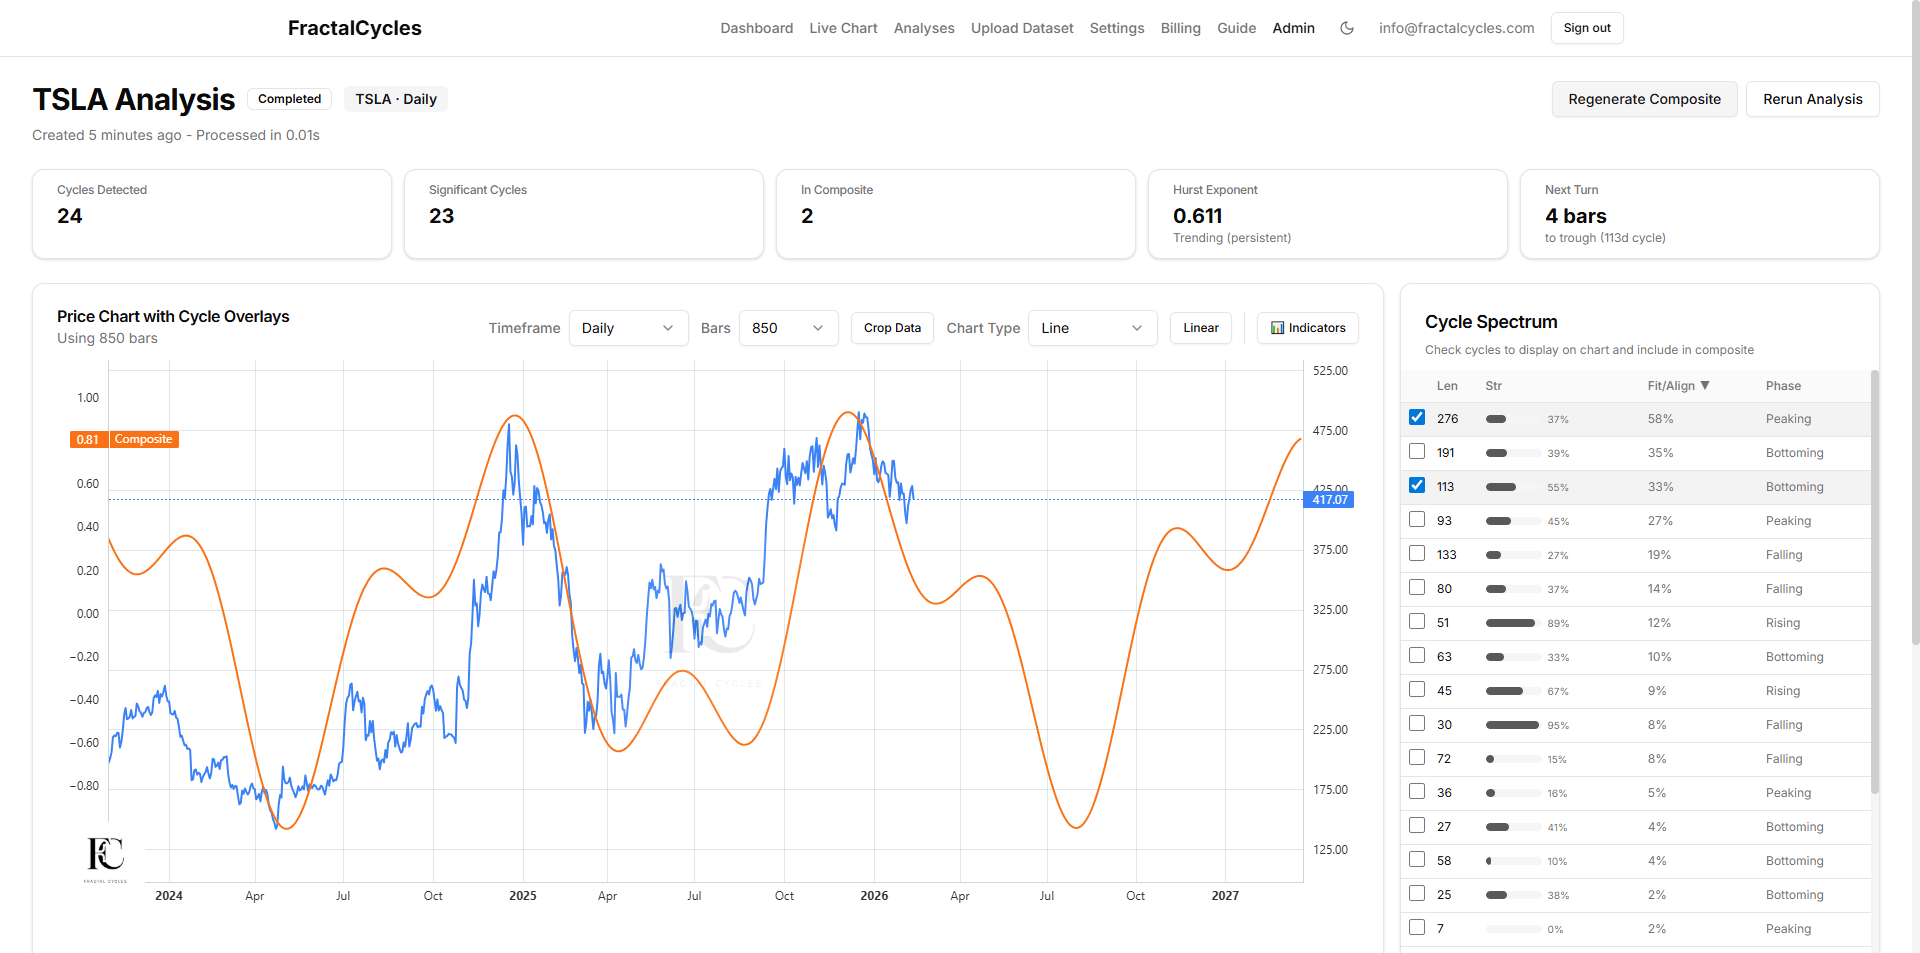 Tutorials
How Composite Wave Projections Work (Tesla Demo)
What is a composite wave, and how do you read one? We walk through the concept step by step using a real Tesla (TSLA) cycle analysis, from detecting cycles to building and interpreting the projection.
FEB 13, 2026 Structure Over Narrative
Why causal explanations dominate despite structurally driven price behavior
Narrative explanations dominate financial discourse not because they govern price behavior, but because human cognition seeks linear causality. In contrast, structural analysis emphasizes the recursive, phase-dependent nature of price behavior across scales, where explanation follows emergence rather than precedes it.
JAN 26, 2026 Framework
Markets as self-similar, fractal systems of price discovery
Markets are best understood not as linear processors of information but as systems exhibiting recursive structure. Price reflects nested cycles of expansion and contraction across timeframes. This structural view prioritizes patterns that recur across scales, irrespective of narrative explanations.
JAN 26, 2026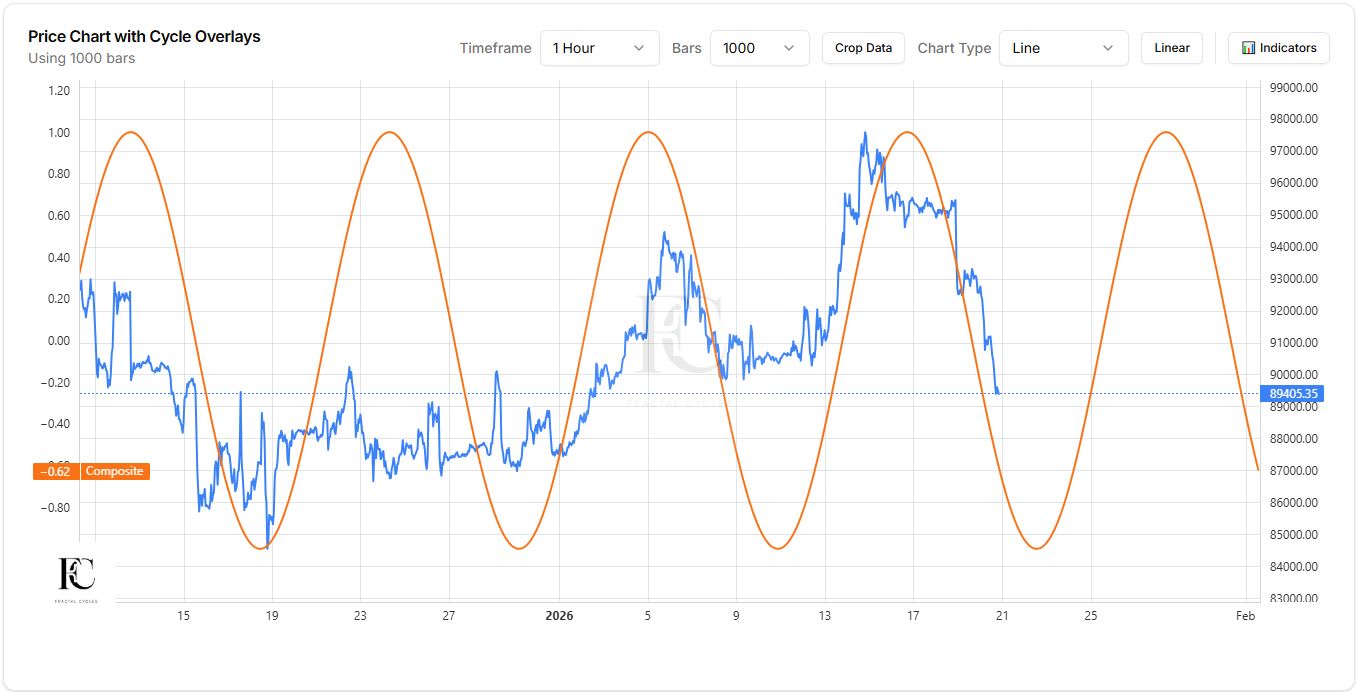 Applied Fractals
Bitcoin Cycles: What If Time Matters More Than Price?
Markets move through time before they move through price. What looks like noise is often a cycle completing its phase.
JAN 20, 2026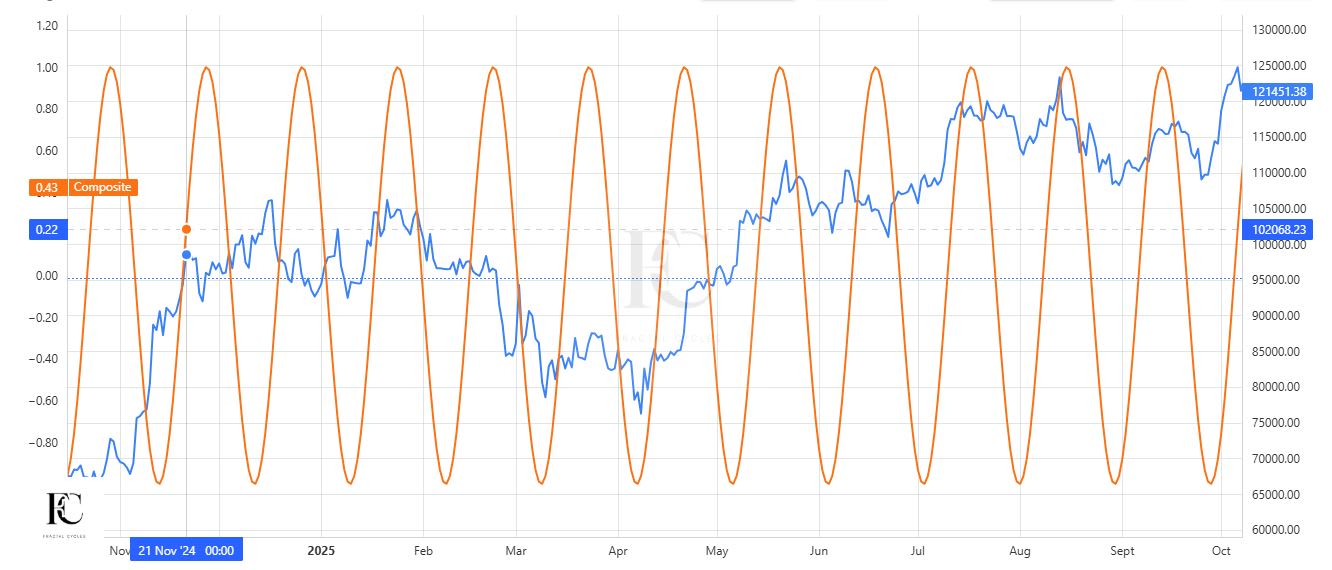 Applied Fractals
Cycles Are the Ultimate DCA Tool for Crypto Investors
JAN 17, 2026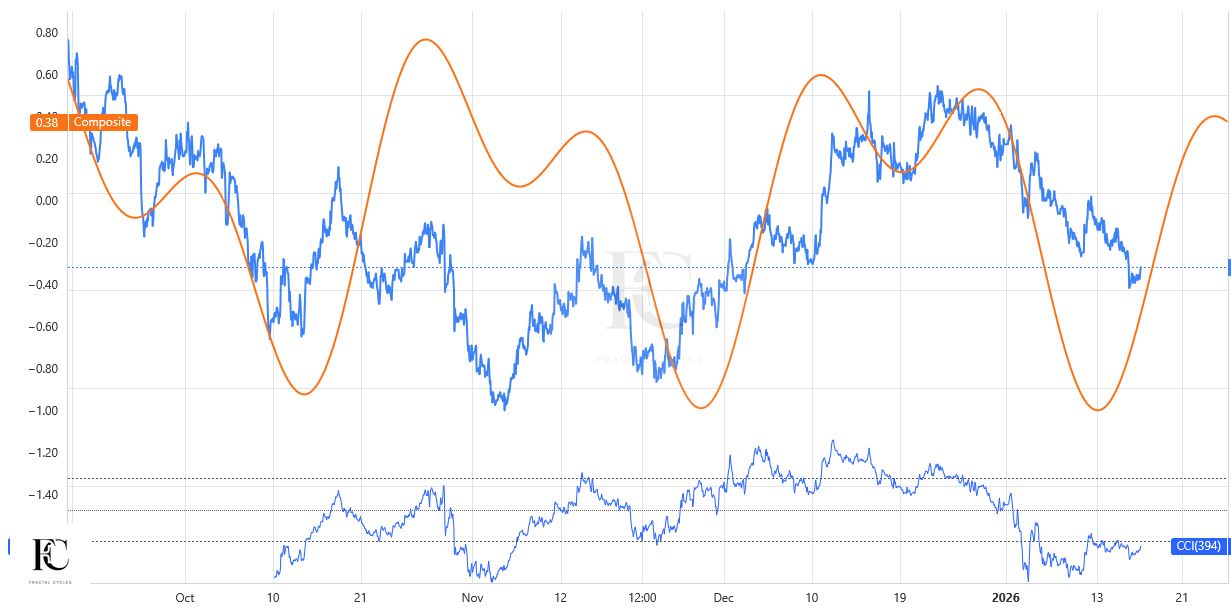 Applied Fractals
Hourly Forex Price Action Observed Through Composite Cycle Structure
JAN 16, 2026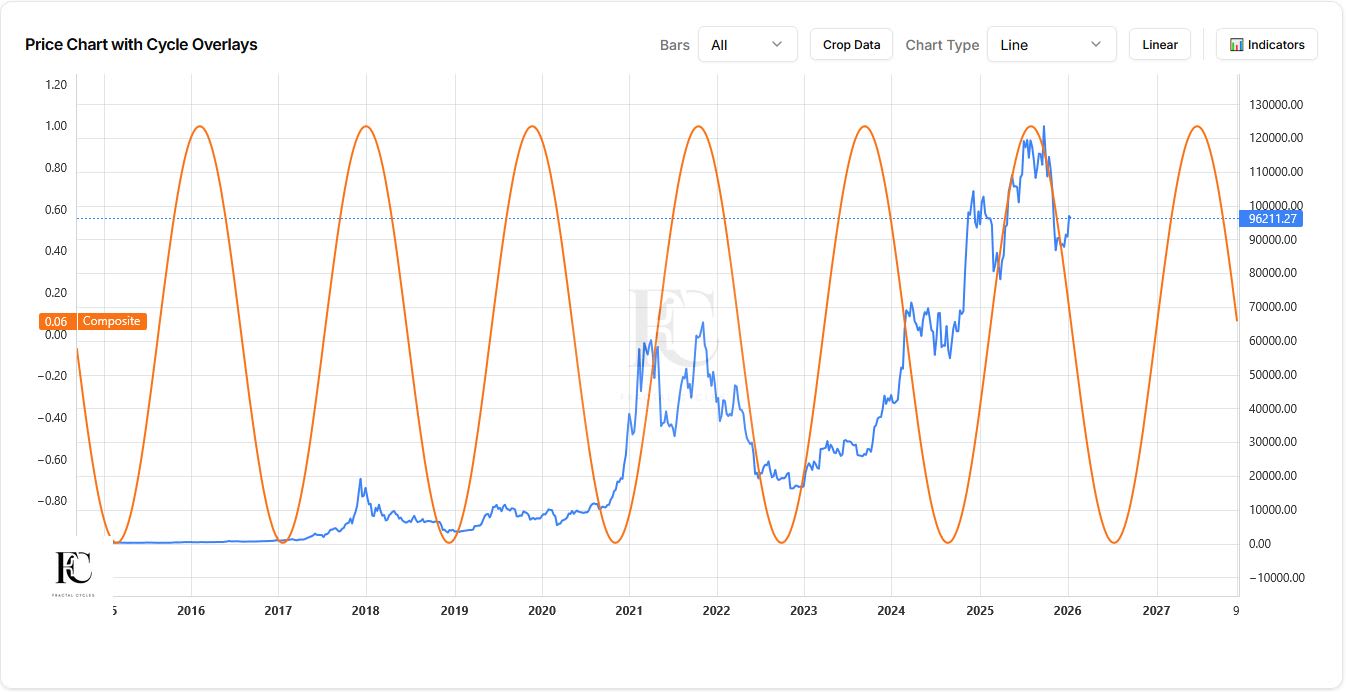 Applied Fractals
Bitcoin observed through a 99-week composite cycle
JAN 15, 2026Get the Monthly Market Cycle State Report
Free market cycle data for 20+ instruments. Dominant periods, regime shifts, and phase transitions delivered every month.
No spam. Unsubscribe anytime.