This is an observation about timing rather than a rule, and it rests on three cycles in which the lowest close came between 513 and 542 days before the next halving, or about 17 months. Those three lows landed on 14 January 2015, 15 December 2018 and 21 November 2022, and although the prices were wildly different, their distance from the next halving varied by only 29 days.
The pattern is easiest to see on a single chart, but that chart carries four separate stories, so this article takes them one at a time. The first figure shows the full timeline, the second compares the tops with the lows, the third lines every cycle up on the halving that ended it, and the fourth shows where the current cycle stands today.
Every price in this article is a daily close from Bitstamp, one of the longest running US dollar exchange records, and every halving date comes from the timestamp of the block at which that halving took place.
A cycle top is the highest close within 730 days after a halving, and a cycle low is the lowest close after that top and before the next halving. Day counts run from the low to the next halving, and months are counted as 30.44 days, which is the length of an average calendar month.
What a halving is and when the next one is due
A halving is a fixed event written into Bitcoin's code, and it happens every 210,000 blocks, at which point the reward paid for each new block is cut in half. Because a new block arrives roughly every ten minutes, halvings fall about four years apart, and so far they have come on 28 November 2012, 9 July 2016, 11 May 2020 and 20 April 2024.
The next halving happens at block 1,050,000, and at the current pace of new blocks that falls between 9 and 13 April 2028. The exact date moves by a few days as block times change, which is why the window later in this article is a few days wider than the three past cycles alone would suggest. For the wider history of how price has behaved after each halving, see the Bitcoin halving cycle guide.
Three lows, each about 17 months before a halving
The first chart puts the whole story in one place, with every halving, every top and every low marked on the price, and a strip at the foot that splits each cycle into its three parts. The orange sections run from a halving to its top, the grey sections run from the top to the low, and the teal sections run from the low to the next halving, which is the part of the cycle this pattern describes.
Every halving, top and low on the Bitcoin price
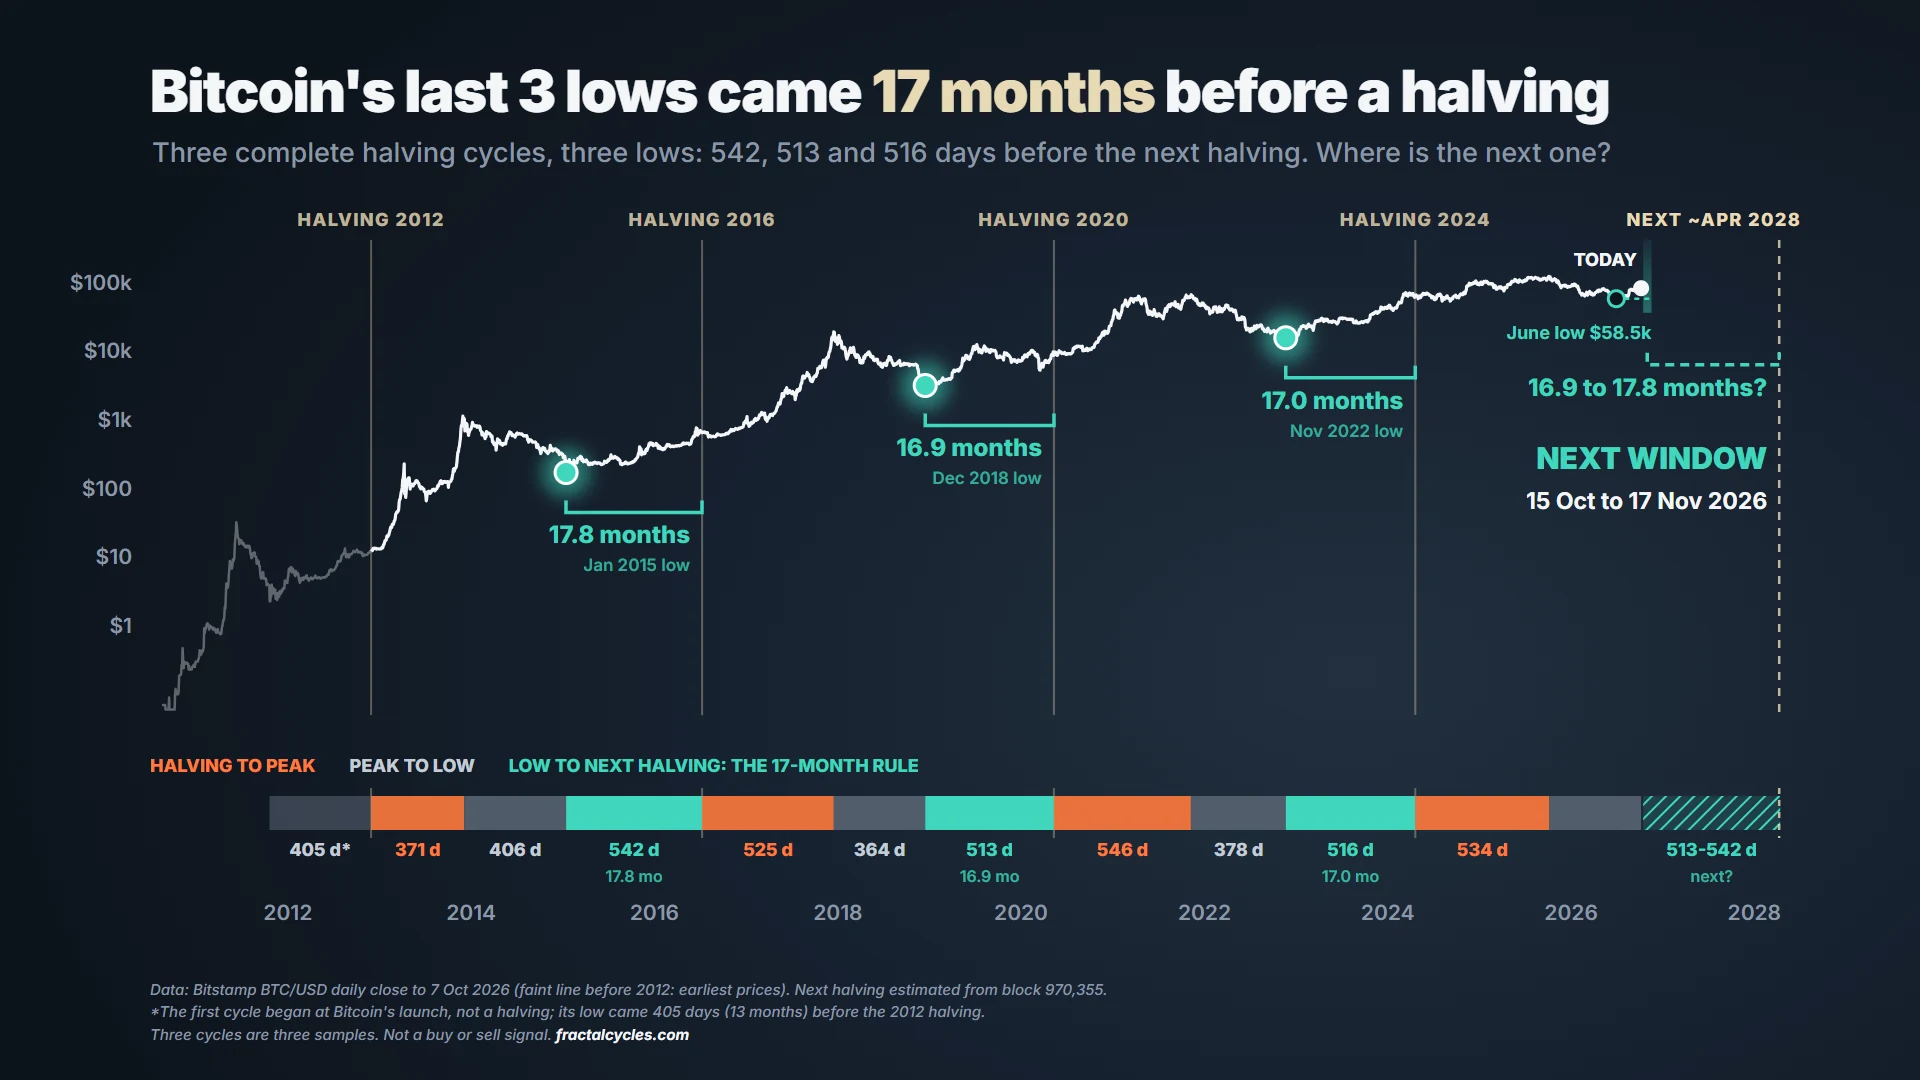
| Cycle | Cycle low (close) | Before next halving |
|---|---|---|
| 2012 to 2016 | 14 January 2015, $171.41 | 542 days, 17.8 months |
| 2016 to 2020 | 15 December 2018, $3,179.54 | 513 days, 16.9 months |
| 2020 to 2024 | 21 November 2022, $15,766 | 516 days, 17.0 months |
Read as a range, the three lows sit 16.9 to 17.8 months before the halving that followed them. The gap from one low to the next was 1,431 days and then 1,437 days, which means two full cycles differed in length by less than a week, even though the price at the low rose almost a hundredfold over the same period.
The very first cycle does not fit, because it did not begin at a halving at all but at Bitcoin's launch. Its low came on 20 October 2011 at $2.24, which was 405 days, or about 13 months, before the 2012 halving. Few people count that first cycle when they study Bitcoin's rhythm, since the market was tiny and thinly traded, but it is still shown on the chart so that nothing is left out.
The tops were spread out, while the lows were not
Most talk about the halving cycle is about tops, and the usual claim is that Bitcoin peaks somewhere between 12 and 18 months after a halving. The four tops so far came 371, 525, 546 and 534 days after their halvings, which spreads them across 175 days, or almost six months, whereas the three lows came within 29 days of each other.
Tops measured from the halving, lows measured to the next one
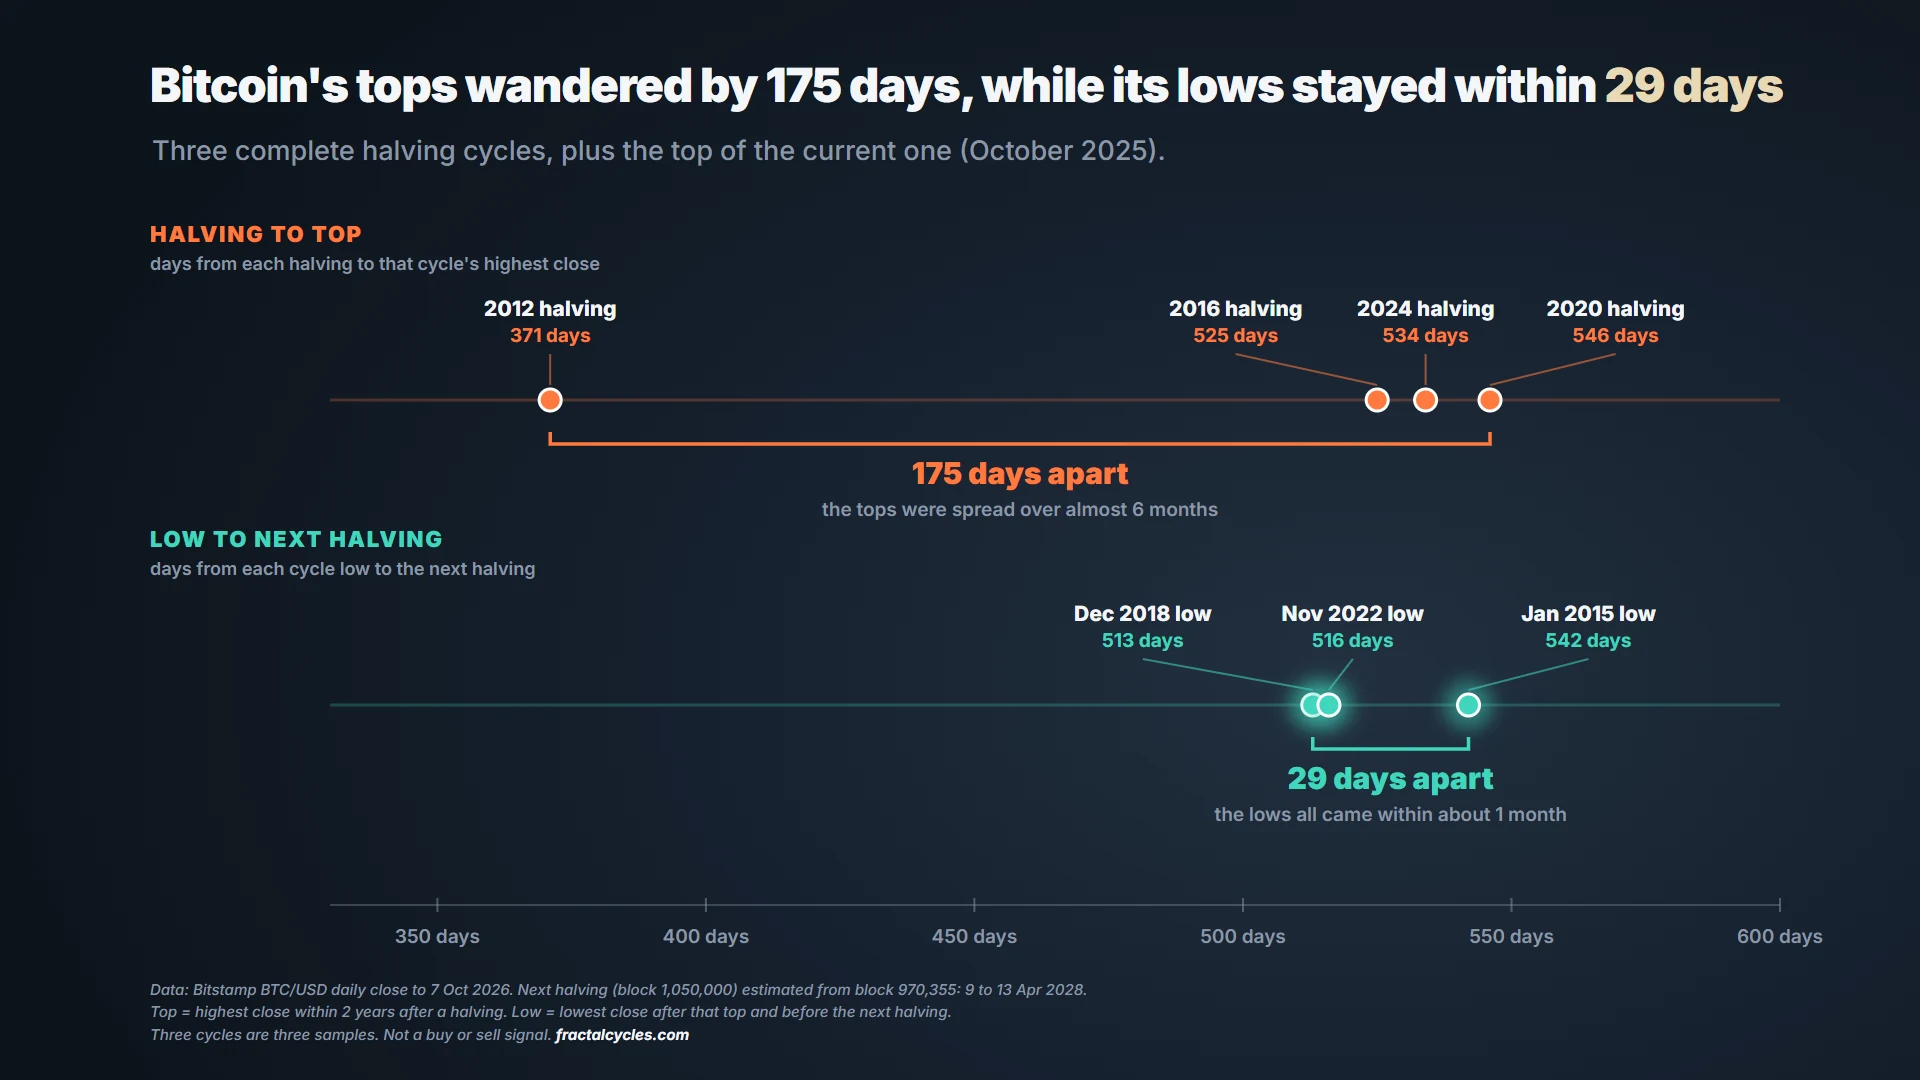
It is fair to point out that the 2013 top came early, and if that first top is set aside, the last three tops sit within 21 days of each other, which is almost as tight as the lows. The difference is that the lows have been tight in every complete cycle, whereas the tops only became tight after the first one, so measured this way the low has been the steadier part of Bitcoin's rhythm.
Lining each cycle up on the halving that ended it
Another way to test the pattern is to stop reading the calendar and instead line each cycle up on the halving that ended it, so that every row counts down to the same moment. When the three complete cycles are drawn this way, each on its own price scale because their prices are so far apart, their lows fall into the same narrow band between 513 and 542 days before the halving.
Four cycles counted down to the halving that ended each one
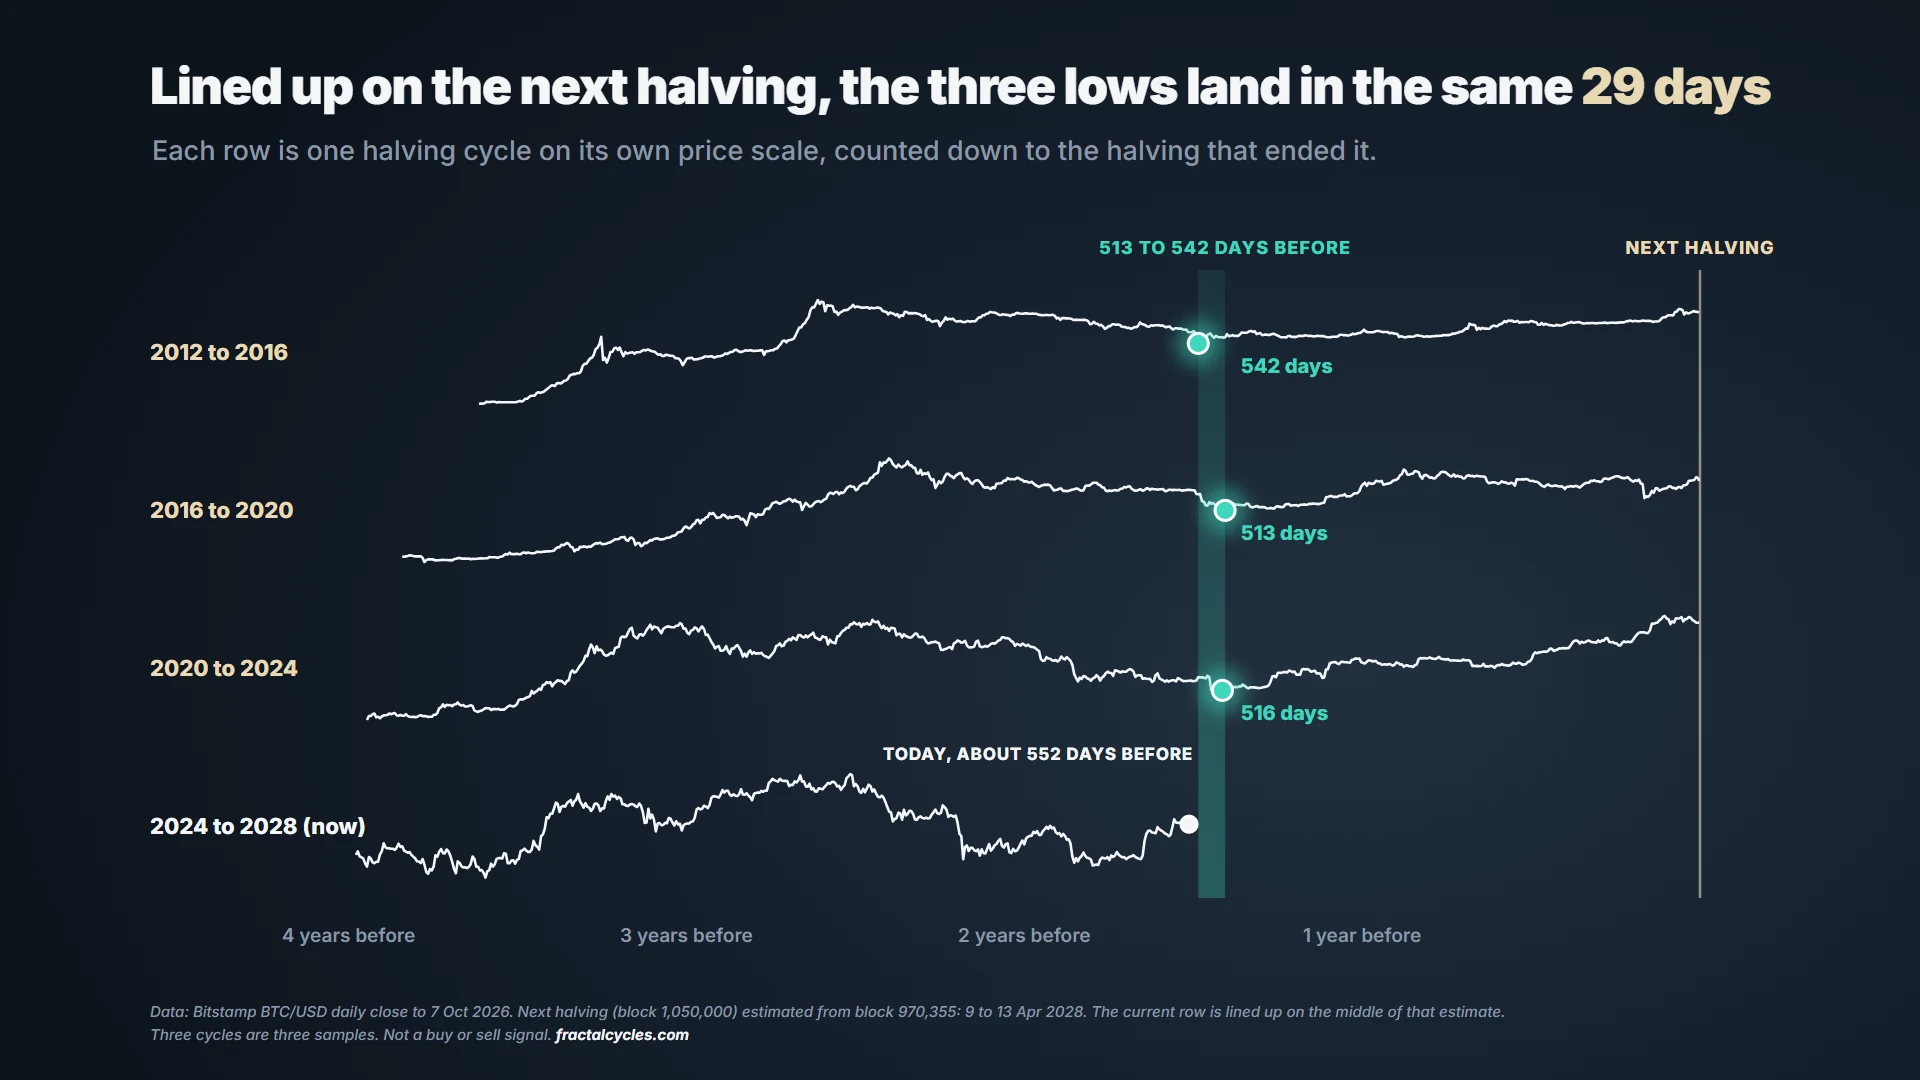
The fourth row is the current cycle, which counts down to the expected April 2028 halving. On 7 October 2026 it sat about 552 days before that halving, which means the current cycle was roughly ten days short of the band, so the part of the cycle in which the past three lows arrived had not yet begun.
Where the current cycle stands
The current cycle topped on 6 October 2025 with a close of $124,728, which was 534 days after the April 2024 halving and close to where the previous two tops had landed. Since then the lowest close has been $58,526 on 30 June 2026, but that low came 649 days before the expected halving, which is far too early to fit the pattern.
The current cycle and the window the pattern points to
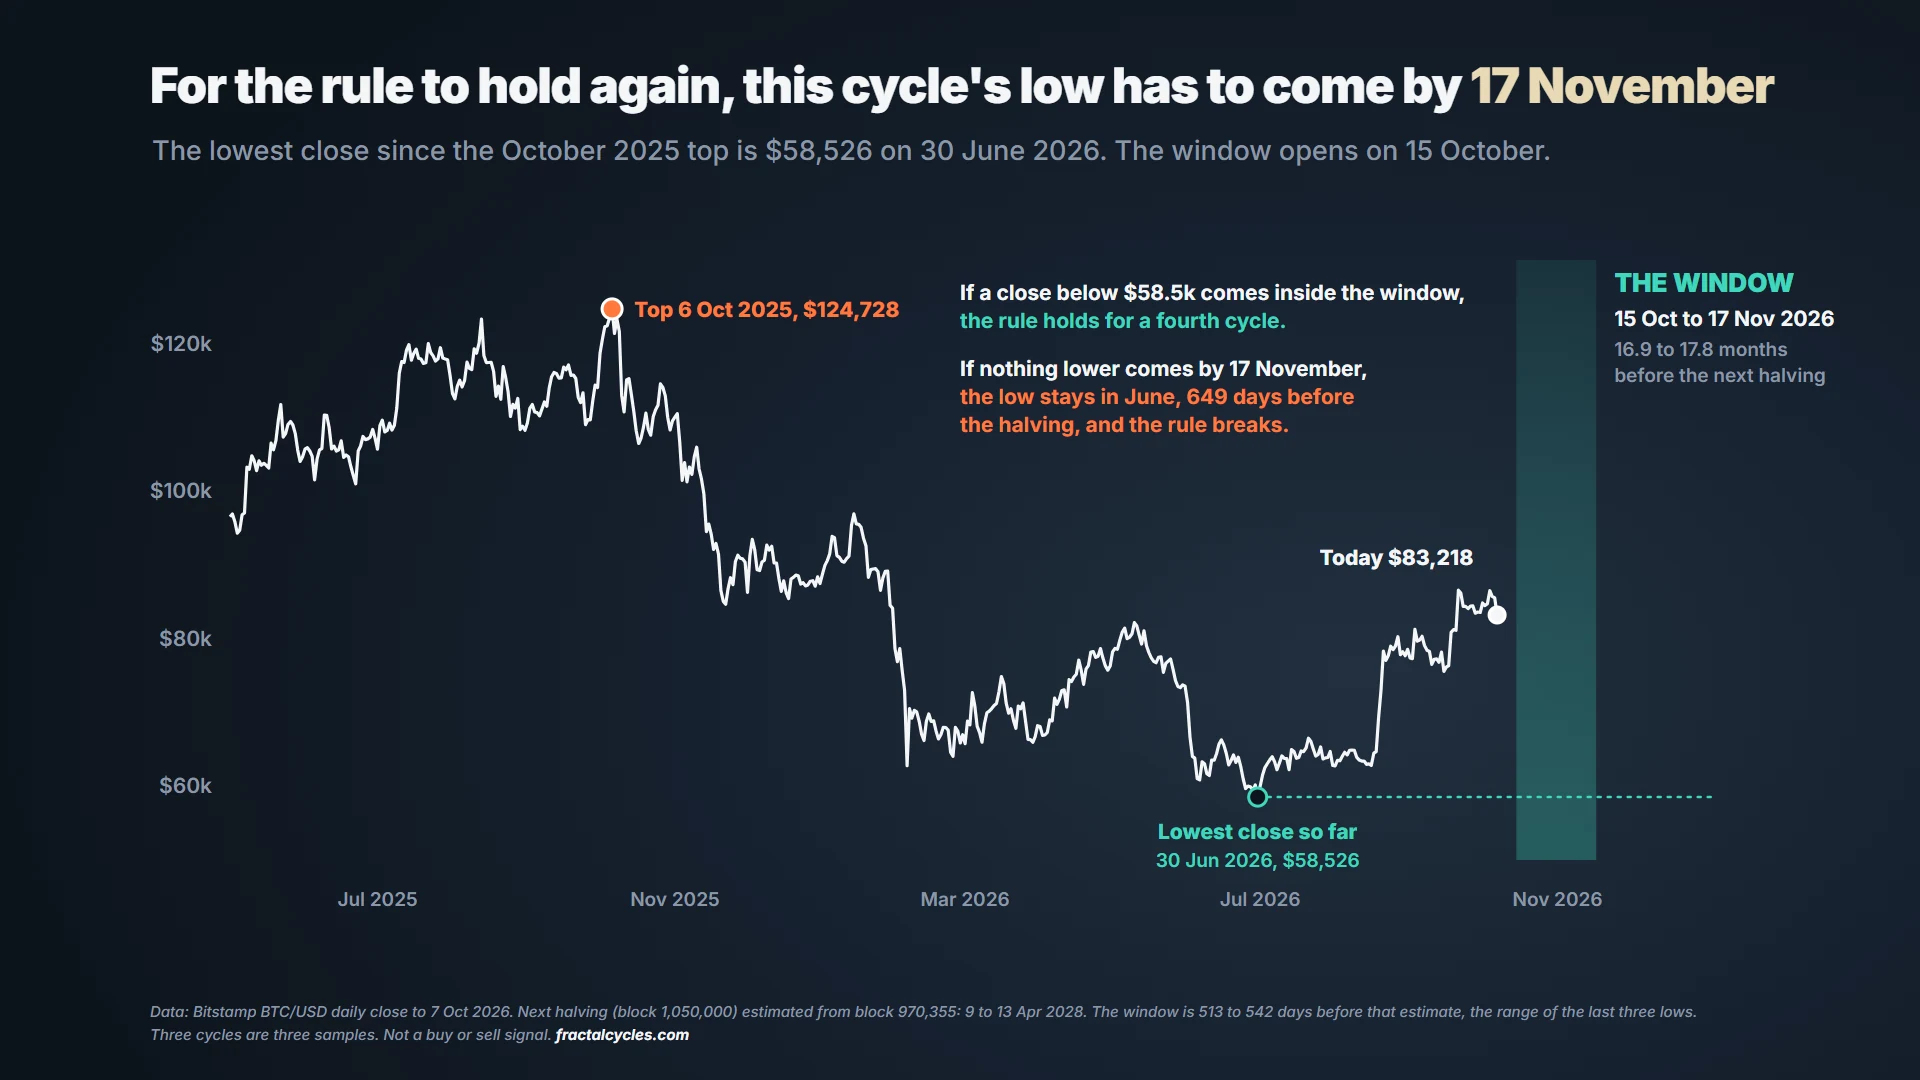
If the pattern is to hold for a fourth cycle, a close below $58,526 has to arrive between 15 October and 17 November 2026, which is the window 16.9 to 17.8 months before the April 2028 halving. Bitcoin closed at $83,218 on 7 October 2026, so a new low inside that window would need a fall of about 30% from that close before 17 November.
A second check points to the same weeks. When the two past gaps from one low to the next, 1,431 and 1,437 days, are added to the November 2022 low, they land between 22 and 28 October 2026, which sits inside the same window and was worked out without using the halving at all.
If a close below $58,526 comes inside the window, the pattern holds for a fourth cycle. If nothing lower comes by 17 November, the June low stands and the pattern breaks.
There is also a third outcome, because a lower close that arrives after 17 November would fall outside the window on the late side, which would break the pattern in a different way. Either way the answer will be known within a few weeks, which makes the current cycle an unusually clean test of an idea that is often repeated but rarely checked.
Why three cycles is not proof
Three matching cycles make an interesting pattern, but they are a small base, and a pattern that has held three times can stop at any point without anything having changed underneath it. Bitcoin is also a different market from the one it was in 2015, since it now trades through funds, futures and large institutions, and any of those changes could stretch or shorten its rhythm.
There is also no agreed reason why the low should keep a fixed distance from the next halving rather than from the last one. One common explanation is that the market starts to price the next supply cut well in advance, but that is a story laid over the data, and it has not been tested in the way the dates themselves have.
That is why this article treats the 17-month pattern as a window worth watching rather than a rule, and why a failure this cycle would be just as informative as a success. For the broader problem of patterns that look strong on a few examples, see Why Most Cycle Analysis Fails.
What this is not
Nothing in this article is a buy or sell signal, and nothing on the FractalCycles platform, now or in the future, is a buy or sell signal either.
The 17-month pattern, like every tool on the platform, marks an area of interest, which here is a window of time in which past cycle lows have tended to arrive. Whether a low comes inside that window, and what that means for any position, is for each reader to judge against their own strategy and their own tolerance for risk.
How to use the window
Treat it as a window, not a date
The pattern points to a span of about five weeks, so no single day inside it carries any special weight, and a low near either edge counts just as much as one in the middle.
Watch the June low
The level that decides it is $58,526, the lowest close since the October 2025 top, because the pattern only holds if a close below it arrives inside the window.
Check it against other evidence
A timing window says when a low has tended to come, not whether one will, so it is worth reading alongside other work. The cycle analysis in Bitcoin 2026: Bear Market or Cycle Trough? reaches the same October and November window by a completely different method.
Know what breaks it
If 17 November 2026 passes with no lower close, the pattern has failed for this cycle, and that result tells you as much about Bitcoin's rhythm as a success would.
Common questions
- When does Bitcoin usually bottom in a halving cycle? In each of the last three complete cycles, Bitcoin's lowest close came between 513 and 542 days before the next halving, which is about 16.9 to 17.8 months. The three lows came in January 2015, December 2018 and November 2022.
- How many days before a halving does Bitcoin bottom? In the last three complete cycles the low came 542, 513 and 516 days before the next halving, an average of about 524 days. This is an observation about past timing only, so it marks a window of interest rather than a forecast.
- When is the next Bitcoin halving? The next halving happens at block 1,050,000. At the current pace of new blocks that falls between 9 and 13 April 2028, and the exact date shifts by a few days as block times change.
- When would Bitcoin's 2026 cycle low be due if the pattern holds? Between 15 October and 17 November 2026, which is 16.9 to 17.8 months before the expected April 2028 halving. For the pattern to hold, Bitcoin would need a close below the 30 June 2026 low of $58,526 inside that window.
- Did the pattern hold in Bitcoin's first cycle? No. The first cycle began at Bitcoin's launch rather than at a halving, and its low came 405 days, about 13 months, before the 2012 halving. The pattern describes the three complete cycles that ran from one halving to the next.
- Is this timing pattern a buy signal? No. Nothing on FractalCycles is a buy or sell signal. The pattern marks a window in which past lows have tended to arrive, and each reader judges it against their own strategy.
Sources
- Bitstamp BTC/USD daily closing prices, August 2011 to 7 October 2026.
- Blockchain.com market price history, used only for the faint line before 2012 in Figure 01.
- mempool.space block timestamps for the four past halvings and the current block height used to estimate the next one.