Advanced Cycle Analysis
Finally Accessible
For decades, the most powerful cycle detection technology was locked behind institutional walls. Until now. FractalCycles delivers cutting-edge analysis that is simplified, actionable, and statistically validated.
See how it works in about a minute
Watch a price chart break into simple waves. Each wave is tested against chance. The ones that pass combine into a projected turning zone. All in 68 seconds.
Cycle research by hand is slow, fragile, and easy to get wrong
Market analysts, individual investors, economists, and cycle enthusiasts all run into the same wall. Doing it manually means wrestling spreadsheets, untested indicators, and gut feel. None of that scales.
Independent Investors & Analysts
- Struggling to separate meaningful market structure from random price noise
- Difficulty identifying whether momentum is strengthening, weakening, or cycling
- Conflicting signals across multiple timeframes leading to inconsistent analysis
Academic & Quantitative Research
- Limited tools for testing cyclical hypotheses on financial time series data
- Difficulty validating whether detected cycles are statistically significant or random artifacts
- Time-consuming workflow when combining spectral analysis, persistence metrics, and statistical testing
Cycle Analysis Enthusiasts
- Most cycle tools feel opaque, outdated, or overly complex
- Hard to explore market rhythm without deep DSP or quantitative finance knowledge
- Difficulty comparing cycles across assets, timeframes, and changing market conditions
Investors New to Cycles
- Cycle terminology feels intimidating without a finance or signal-processing background
- Hard to know which patterns are statistically real and worth learning to read
- Easy to react to headlines without a structural frame to anchor decisions against
Four tools, one workspace, every cycle question covered
Spectrum, validation, regime, and convergence. The full cycle research stack on every analysis. No tab-switching, no spreadsheets.
Spectrum Analysis
Goertzel DFT pulls the dominant cycle periods out of any OHLCV series, intraday to monthly. You see the spectrum, you pick what to act on.
Statistical Validation
Every detected cycle gets a Bartels p-value. You see the number, you decide what is signal and what is noise. No black box.
Regime Detection
Hurst exponent classifies your market today as trending, mean-reverting, or random walk. Pick the strategy that matches the regime.
J.M. Hurst Principles
Cycle nesting, summation, harmonicity, and the named period cascade. The framework J.M. Hurst published in 1970, baked into every detection pass.
Built to give you a research edge, not a black box
Transparent math, your data, statistically validated outputs. Every signal you see comes with the test it passed.
Built for the long series
Process up to Max bars per run on Ultra. Cycle detection runs in a worker queue so your tab never hangs while the math churns.
You pick the cycles
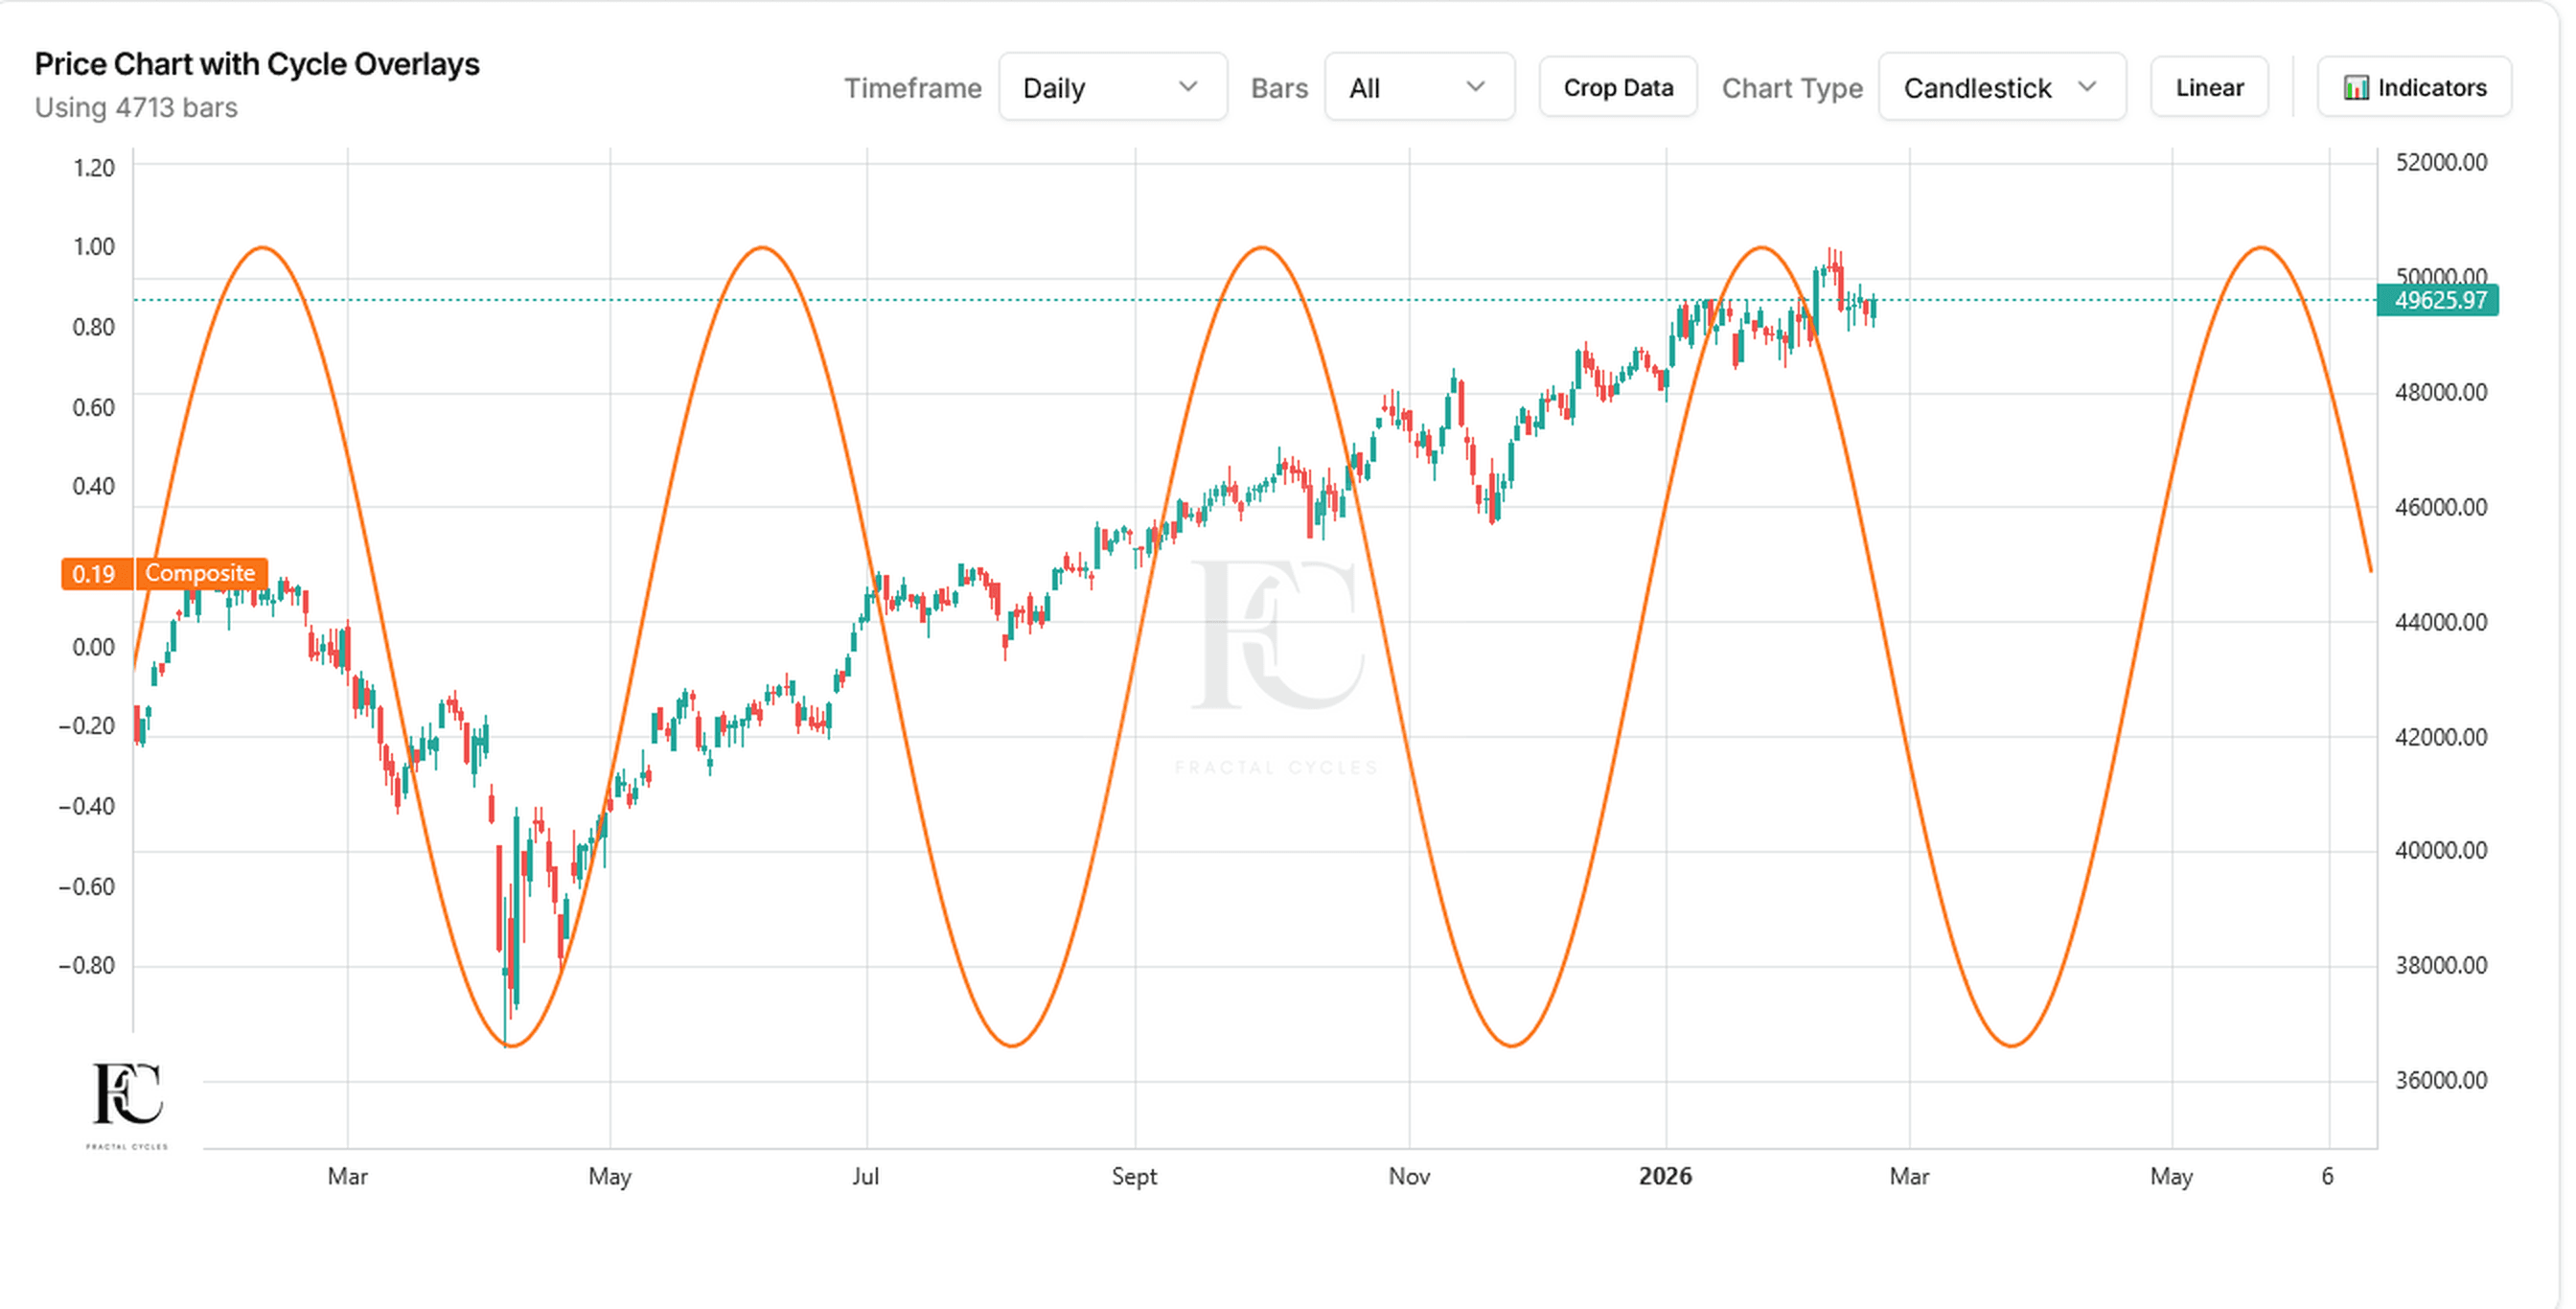
Composite waves project a likely turning zone from the cycles you select. Toggle them on, toggle them off, watch the projection breathe.
Plans that fit how you work
Free covers your first idea. Pro covers your weekly routine. Ultra covers deep research. Cancel any paid plan in two clicks, no retention calls.
Bring Your Own Data
Have a thin altcoin, a private feed, or your firm's internal book? Drop a CSV. Same engine, same statistics, your dataset.
Static and Dynamic engines
Pick how the composite behaves: Static locks magnitudes at analysis time. Dynamic re-runs the math fresh on every new bar so magnitude and phase breathe with the chart.
The same math the quants use
Goertzel DFT, Bartels significance, Hurst exponent. The same stack used in serious cycle research since the 1990s, finally in one workspace.
The Institutional Edge You Have Been Missing
While most investors struggle with lagging indicators and guesswork, institutions have been using advanced cycle analysis to identify recurring market patterns with precision. The math is finally accessible to the rest of us.
The Old Way
- Lagging Indicators: Relying on outdated tools that only show you where the market has been, not the underlying patterns driving it.
- Emotional Decisions: Guessing market direction based on hope, fear, and hype, leading to inconsistent results.
- Incomplete Picture: Missing the underlying market cycles that drive major trends and reversals.
The FractalCycles Way
- Pattern Analysis: Utilize advanced cycle detection to identify recurring market patterns based on historical data.
- Data-Driven Precision: Make decisions with confidence, backed by statistically validated signals.
- Total Clarity: See the complete market picture and understand the forces driving price action.
What investors and researchers are saying
Real users on what changed in their workflow once the spreadsheets went away.
I stopped spending Sundays rebuilding a Goertzel in Excel. The Bartels column is what sold me. Either a cycle passes or it does not, and I get the p-value to back it up.
The transparency is the win. FractalCycles shows me HOW a cycle was detected, not just THAT it was. I can audit every step before I quote it in my research notes.
I run cycle analysis on FX and a few crypto pairs every Monday morning. What used to be a three-hour ritual is now a coffee and a refresh.
Testimonials reflect individual experience. FractalCycles is a research tool. Markets are inherently uncertain and past patterns do not guarantee future results.
From Raw Data to Actionable Insights
Upload your market data, let our algorithms detect hidden cycles, validate them statistically, and identify potential turning points. All in a few clicks.
Upload or fetch data
CSV import or live data from major exchanges
Detect cycles automatically
Advanced spectrum analysis finds hidden patterns
Identify turning points
Combine cycles to recognize potential reversal zones
Fresh research, deep tutorials
When Will Bitcoin Bottom? What the Last 3 Halvings Reveal
In each of the last three halving cycles, Bitcoin's lowest close came 513 to 542 days before the next halving, about 17 months. The tops wandered by 175 days while the lows stayed within 29, and the next window runs from 15 October to 17 November 2026.
Is This Market Actually Trending? A Field Guide to Reading Persistence
A market with no memory at all reads as high as 0.66 over 50 bars, so the popular 0.55 rule labels pure noise a trend. Why the honest threshold shrinks as data grows, and why one length outside the range fools you about a quarter of the time.
The Contrarian's Missing Reference
Most retail market participants are already contrarian by instinct. Across 143 oversold episodes on five instruments, the first reading was the low only 21.7% of the time. What fading a move is missing is not conviction. It is a clock.
Why Static and Dynamic Cycle Analysis Both Matter
Static cycle analysis anchors structural rhythm. Dynamic analysis re-estimates period and phase each bar. See why serious analysts use both, with motion-graphic examples.
Spotting Hurst Cycles in the Spectrum: A Conversion Table from Weekly to Intraday
A conversion table and a three-layer gating rule for matching detected periods to J.M. Hurst's eleven named cycles, on any instrument and any timeframe.
Get the Monthly Market Cycle State Report
Free market cycle data for 20+ instruments. Dominant periods, regime shifts, and phase transitions delivered every month.
No spam. Unsubscribe anytime.
Free forever to start, paid when you outgrow it
Same math on every tier. Paid plans unlock larger datasets, more analyses, and the live-tick Dynamic engine.
Free
For the curious analyst, no card needed.
- Up to 600 bars per analysis
- Goertzel + Bartels + Hurst
- Live data: Yahoo, FRED
Pro
For the active analyst running cycle research weekly.
- Everything in Free
- Up to 900 bars per analysis
- More analyses, saved history
- Dynamic composite engine
Ultra
For the dedicated researcher who needs depth and live-tick.
- Up to Max bars per analysis
- Dynamic composite, live tick
- Unlimited analyses
Run your first analysis in the next two minutes
Pull live S&P, BTC, gold, or upload your own CSV. If the math does not change how you read your charts, just walk away. Nothing lost.