Market Regime vs Market Trend: Why the Distinction Matters
A market can be in a trending regime without currently trending. Understanding this distinction prevents strategy mismatch.
About this content: This page describes observable market structure through the Fractal Cycles framework. It does not provide forecasts, recommendations, or trading instructions.
Most articles on this site do not include static screenshots. Instead, we encourage you to run a free analysis on the platform to see exactly what is being described, with live, interactive results.
Market regime vs market trend distinguishes two concepts that sound similar but operate at different timescales and carry different implications. A trend is observable directional price movement, measured by price action and indicators like ADX over days to weeks. A regime is the underlying statistical character of the market, measured by the Hurst exponent over weeks to months. A market can be in a trending regime (H > 0.55) without currently trending, or show an apparent trend in a mean-reverting regime (H < 0.45) that is likely to fail. Strategy selection should follow regime; entry timing should follow trend.
What Is a Trend?
A trend is observable directional price movement:
- Uptrend: Higher highs and higher lows
- Downtrend: Lower highs and lower lows
- Measured by price action, moving averages, ADX direction
- Can start or end at any time
Trend describes what is happening now.
What Is a Regime?
A regime is the underlying market character:
- Trending regime: Market tends to develop persistent moves (high Hurst)
- Mean-reverting regime: Market tends to oscillate (low Hurst)
- Measured by statistical properties over extended periods
- Changes less frequently than individual trends
Regime describes how the market tends to behave.
The Mismatch Problem
Consider these scenarios:
Trending regime, no current trend: Hurst is high (0.65) indicating persistence, but price is currently consolidating. Trend-following strategies are appropriate, but entries should wait for the next trend to begin.
Mean-reverting regime, apparent trend: Hurst is low (0.40) but price has moved directionally for two weeks. The "trend" is likely to fail. Trend followers will get trapped.
Misreading regime as trend (or vice versa) leads to strategy deployment at the wrong time.
Practical Implications
Strategy selection: Choose based on regime, not current trend
- Trending regime → use trend-following strategies
- Mean-reverting regime → use mean-reversion strategies
Timing selection: Choose based on current trend within regime
- Trending regime + trend starting → aggressive entries
- Trending regime + trend extended → wait for pullback
- Trending regime + no trend → wait for breakout
Detect hidden cycles in any market
See which cycle periods are statistically significant in any market data — run a free analysis with our robust cycle detection software.
Try it free NowMeasurement Differences
To measure trend:
- Price vs moving averages
- ADX and DI lines
- Higher highs/higher lows pattern
- Relatively short lookback (days to weeks)
To measure regime:
- Hurst exponent
- Autocorrelation of returns
- Distribution of return persistence
- Longer lookback (weeks to months)
The Timeframe Wrinkle
Regime and trend can differ across timeframes:
- Weekly regime may be trending while daily is choppy
- Daily trend may be up while hourly is mean-reverting
Match your regime and trend measurements to your trading timeframe. A day trader should not use weekly regime to time intraday entries.
Decision Framework
- Identify regime using Hurst or similar (slow-changing)
- Select appropriate strategy type based on regime
- Identify trend state using price action (fast-changing)
- Time entries based on trend state within regime context
- Monitor both, regime can shift, invalidating strategy selection
Common Errors
- Seeing a strong trend and assuming trending regime → Trend may be exhausting
- Seeing choppy price and assuming mean-reverting regime → May be pause in trending regime
- Switching strategies based on short-term price action → Regime requires longer observation
Regime is the slower-moving context; trend is the faster-moving state within that context. Respect the difference in their timescales.
A Worked Example: Persistent Regime With ADX Dips
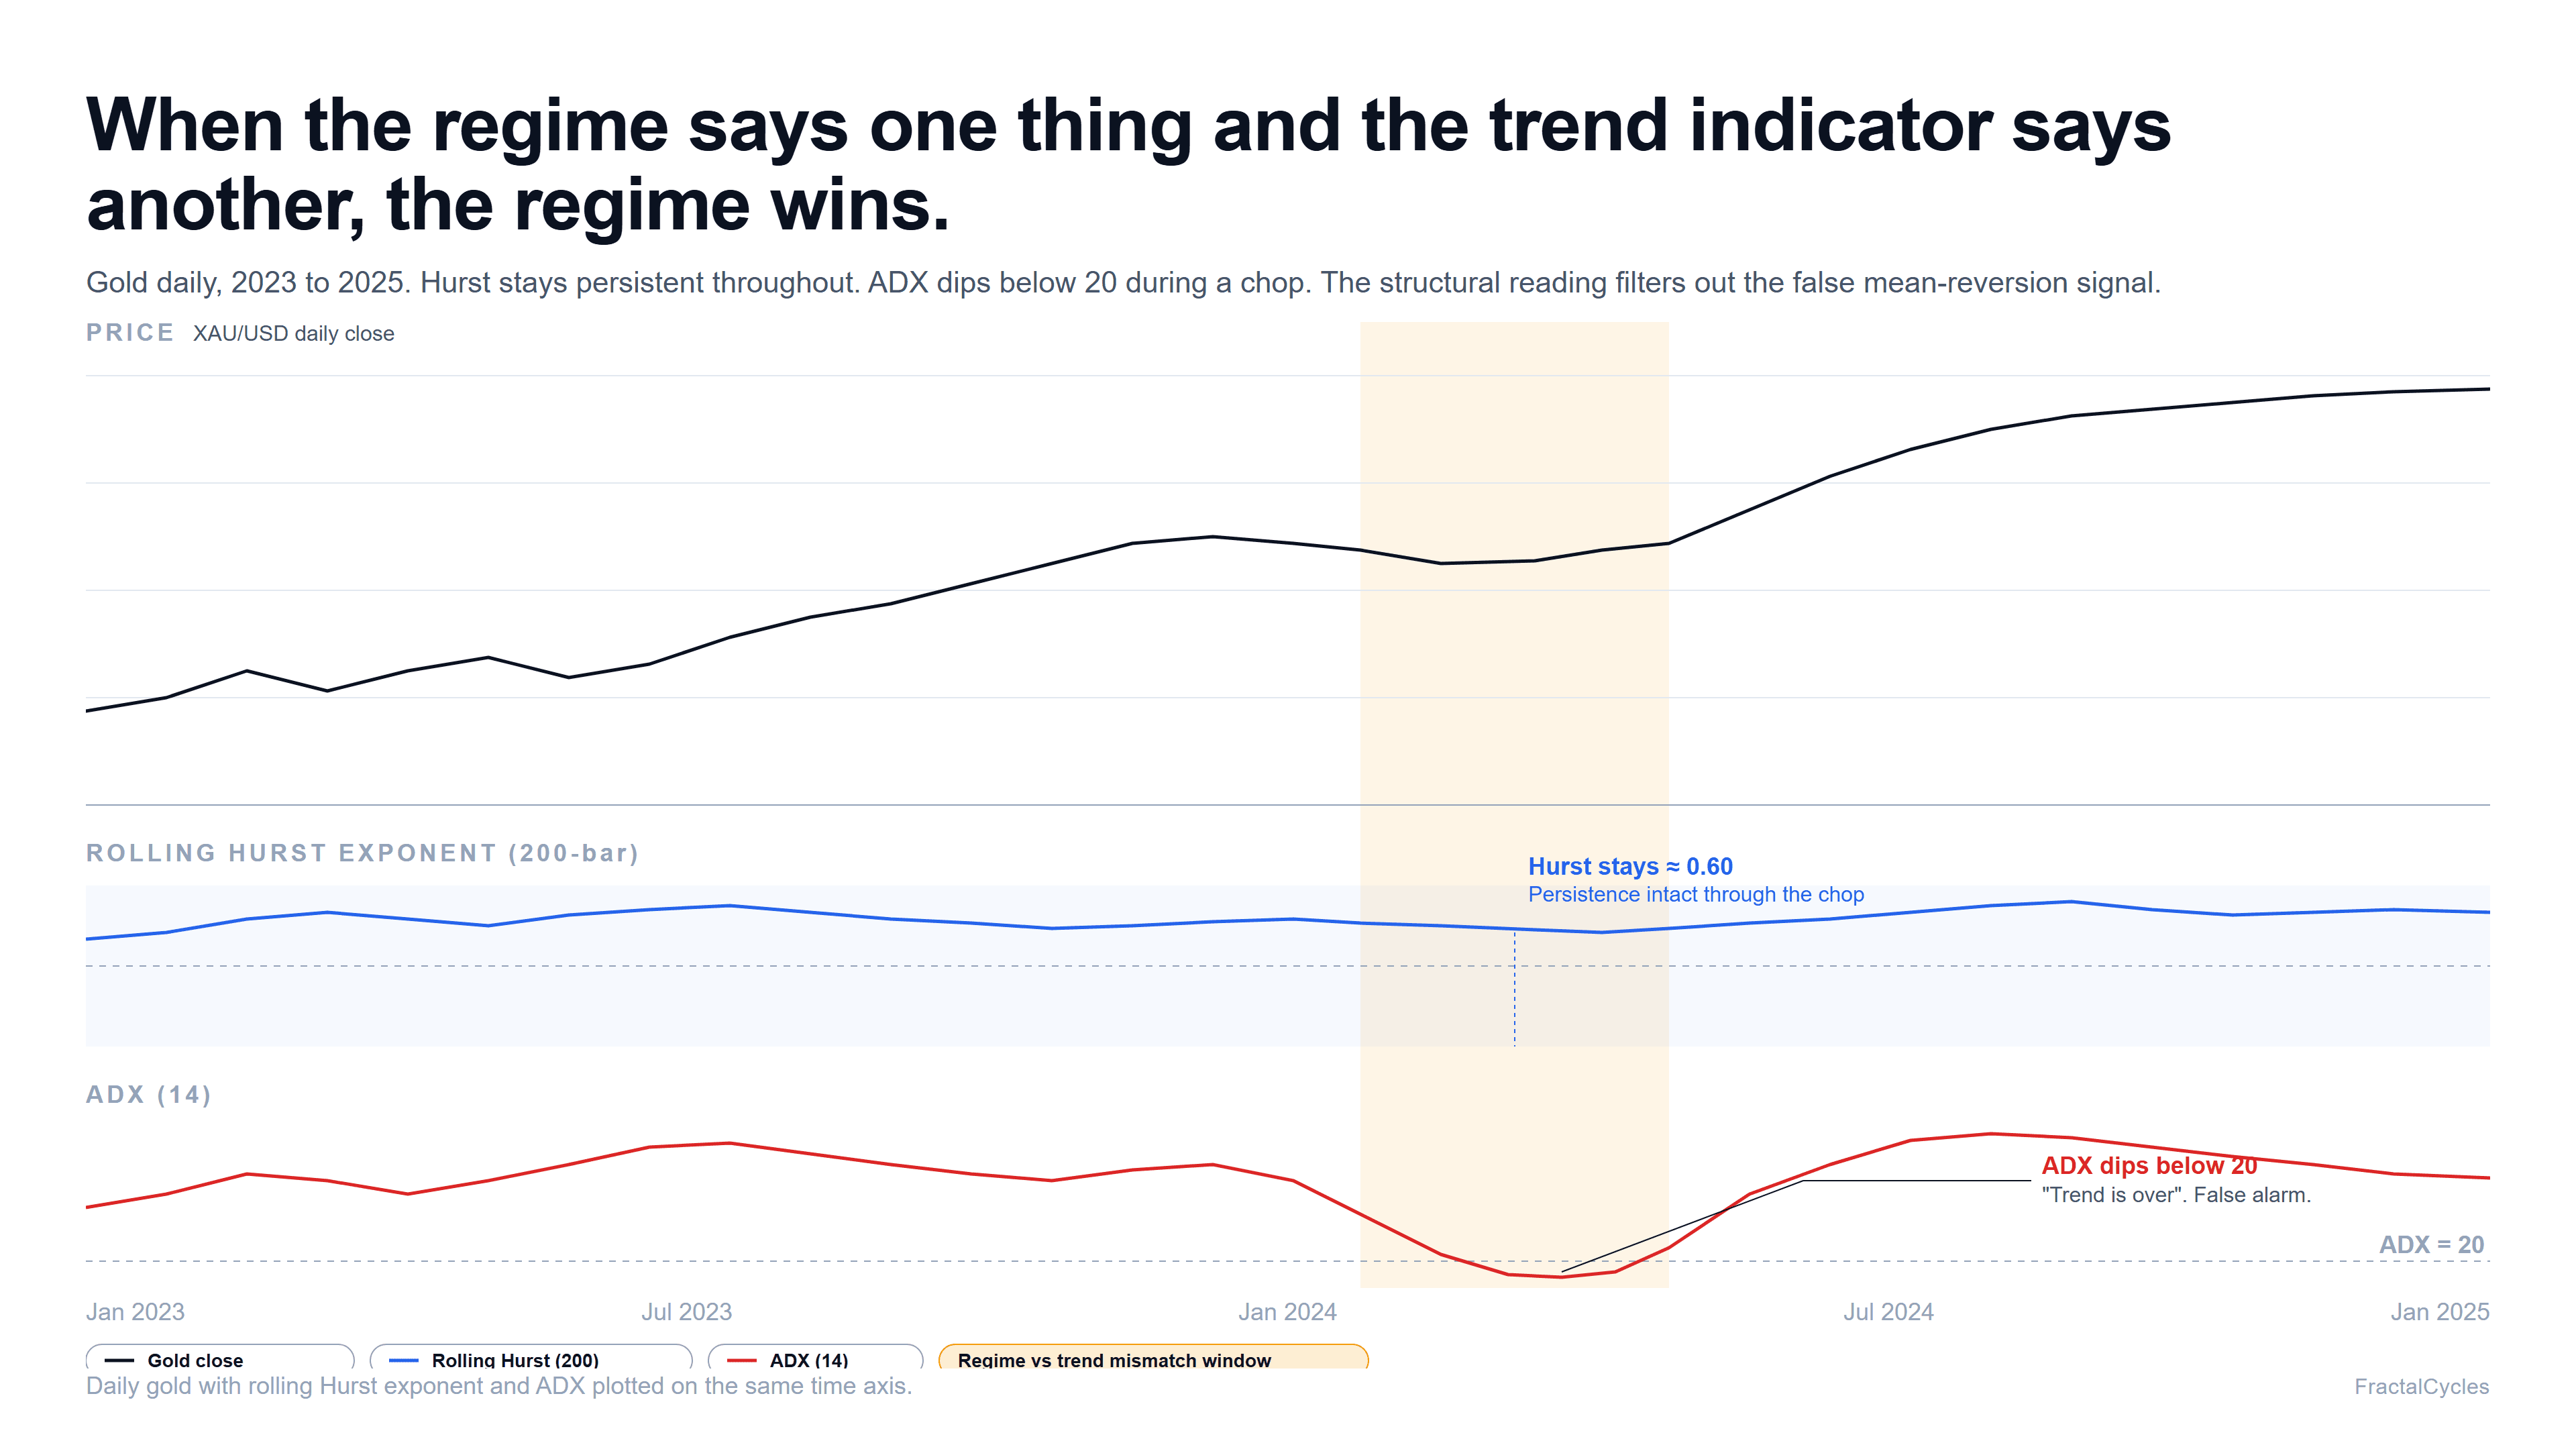
Consider an illustrative two-year window on a daily chart, the kind of pattern that shows up routinely on instruments like gold during persistent uptrends. The rolling Hurst exponent, computed on a 200-bar lookback, sits between roughly 0.55 and 0.65 for most of the period, indicating a persistent regime. ADX, by contrast, drops below 20 several times during the same window, including a stretch of three to four weeks where price visibly chops sideways. A pure-trend reader would see those ADX dips as evidence the trend is over and rotate into a mean-reversion playbook.
The structural reading separates two questions. The regime question is "does this market favor persistence right now," and the answer through the whole window is yes. The trend question is "is price actively trending in this small slice," and the answer in the choppy stretch is no. The mistake is letting the second answer override the first. In a persistent regime, mean-reversion entries during pauses tend to be picked off when the next directional leg resumes, even if a textbook ADX reading was supportive of the opposite trade at that moment.
The corollary holds when Hurst sits near 0.40. A two-week directional move can look like a textbook trend, but the regime context says the move is more likely a swing within a range. Position sizing should reflect the regime, not the local trend. Readers who want the measurement details can review how the Hurst exponent is computed and market regime detection, with a worked instrument view on the gold market page.
Framework: This analysis uses the Fractal Cycles Framework, which identifies market structure through spectral analysis rather than narrative explanation.
Written by Ken Nobak
Market analyst specializing in fractal cycle structure
Get the Monthly Market Cycle State Report
Free market cycle data for 20+ instruments. Dominant periods, regime shifts, and phase transitions delivered every month.
No spam. Unsubscribe anytime.
Disclaimer
This content is for educational purposes only and does not constitute financial, investment, or trading advice. Past performance does not guarantee future results. The analysis presented describes observable market structure and should not be interpreted as predictions, recommendations, or signals. Always conduct your own research and consult with qualified professionals before making trading decisions.
See cycles in your own data
Apply the Fractal Cycles framework to any market using our analysis tools. Start with a free account.