Structural Analysis vs Technical Analysis
Both analyze price charts. Structural analysis asks different questions and uses different tools than traditional technical analysis.
About this content: This page describes observable market structure through the Fractal Cycles framework. It does not provide forecasts, recommendations, or trading instructions.
Most articles on this site do not include static screenshots. Instead, we encourage you to run a free analysis on the platform to see exactly what is being described, with live, interactive results.
Structural analysis vs technical analysis represents the distinction between identifying the underlying periodic structures in price data through statistical methods, and recognizing visual chart patterns through interpretive judgment. Technical analysis looks for discrete patterns (head and shoulders, triangles) and uses fixed-parameter indicators (RSI, MACD). Structural analysis detects continuous cyclic processes through spectral analysis, validates them with the Bartels significance test, and uses the Hurst exponent for regime classification. Both analyze price charts, but structural analysis provides objectivity and statistical rigor that traditional technical methods lack.
Traditional Technical Analysis
Technical analysis typically involves:
- Pattern recognition: Head and shoulders, triangles, flags
- Indicators: RSI, MACD, Bollinger Bands
- Support/resistance: Price levels where buying or selling emerged
- Volume analysis: Confirmation of price moves
The focus is on identifying setups that have historically preceded certain outcomes, then looking for those setups in current data.
Structural Analysis
Structural analysis focuses on:
- Cycle detection: Identifying recurring oscillations in price
- Regime identification: Characterizing market behavior (trending vs reverting)
- Statistical validation: Testing whether patterns exceed random expectation
- Phase location: Determining position within detected cycles
The focus is on understanding the underlying structure that generates price movement, not on recognizing specific visual patterns.
Key Philosophical Differences
Pattern vs structure: Technical analysis looks for discrete patterns (a head and shoulders formed). Structural analysis looks for continuous processes (a 40-bar cycle is currently in its rising phase).
Discretionary vs statistical: Technical patterns often require interpretation (is this a valid triangle?). Structural analysis uses statistical tests (does this cycle pass Bartels at 50%?).
Signal vs context: Technical analysis often generates trade signals (RSI oversold = buy). Structural analysis provides context (low Hurst suggests RSI signals may work).
Detect hidden cycles in any market
See which cycle periods are statistically significant in any market data — run a free analysis with our robust cycle detection software.
Try it free NowOverlapping Territory
Some concepts appear in both frameworks:
- Both recognize that prices oscillate
- Both use historical data to inform expectations
- Both acknowledge that patterns can fail
- Both can be combined with fundamental analysis
The difference is more in approach and rigor than in fundamental incompatibility.
Advantages of Structural Approach
- Objectivity: Statistical validation removes interpretive ambiguity
- Quantifiability: Cycles have measurable properties (period, phase, power)
- Context provision: Helps filter which technical signals are likely to work
- Regime awareness: Identifies when to apply different strategies
Limitations of Structural Approach
- Complexity: Requires more computational sophistication
- Data requirements: Needs sufficient history for reliable detection
- Not predictive: Describes structure, not future prices
- Can miss non-cyclic opportunities: News-driven events, for example
Combining Approaches
The most robust analysis combines structural and technical elements:
- Use structural analysis to understand regime and cycle phase
- Use technical patterns as potential triggers within the structural context
- Apply technical indicators with settings informed by cycle length
- Use statistical validation to filter technical patterns
Technical analysis provides the vocabulary of patterns; structural analysis provides the grammar that determines when those patterns are meaningful.
Practical Example
A technical analyst sees an RSI oversold reading and considers buying.
A structural analyst first checks: Is Hurst low (mean-reverting), suggesting RSI signals work? Or is Hurst high (trending), suggesting the oversold reading is a trap?
The structural context does not replace the technical signal, it qualifies it.
A Worked Example: SPX Daily, 40-Bar Cycle
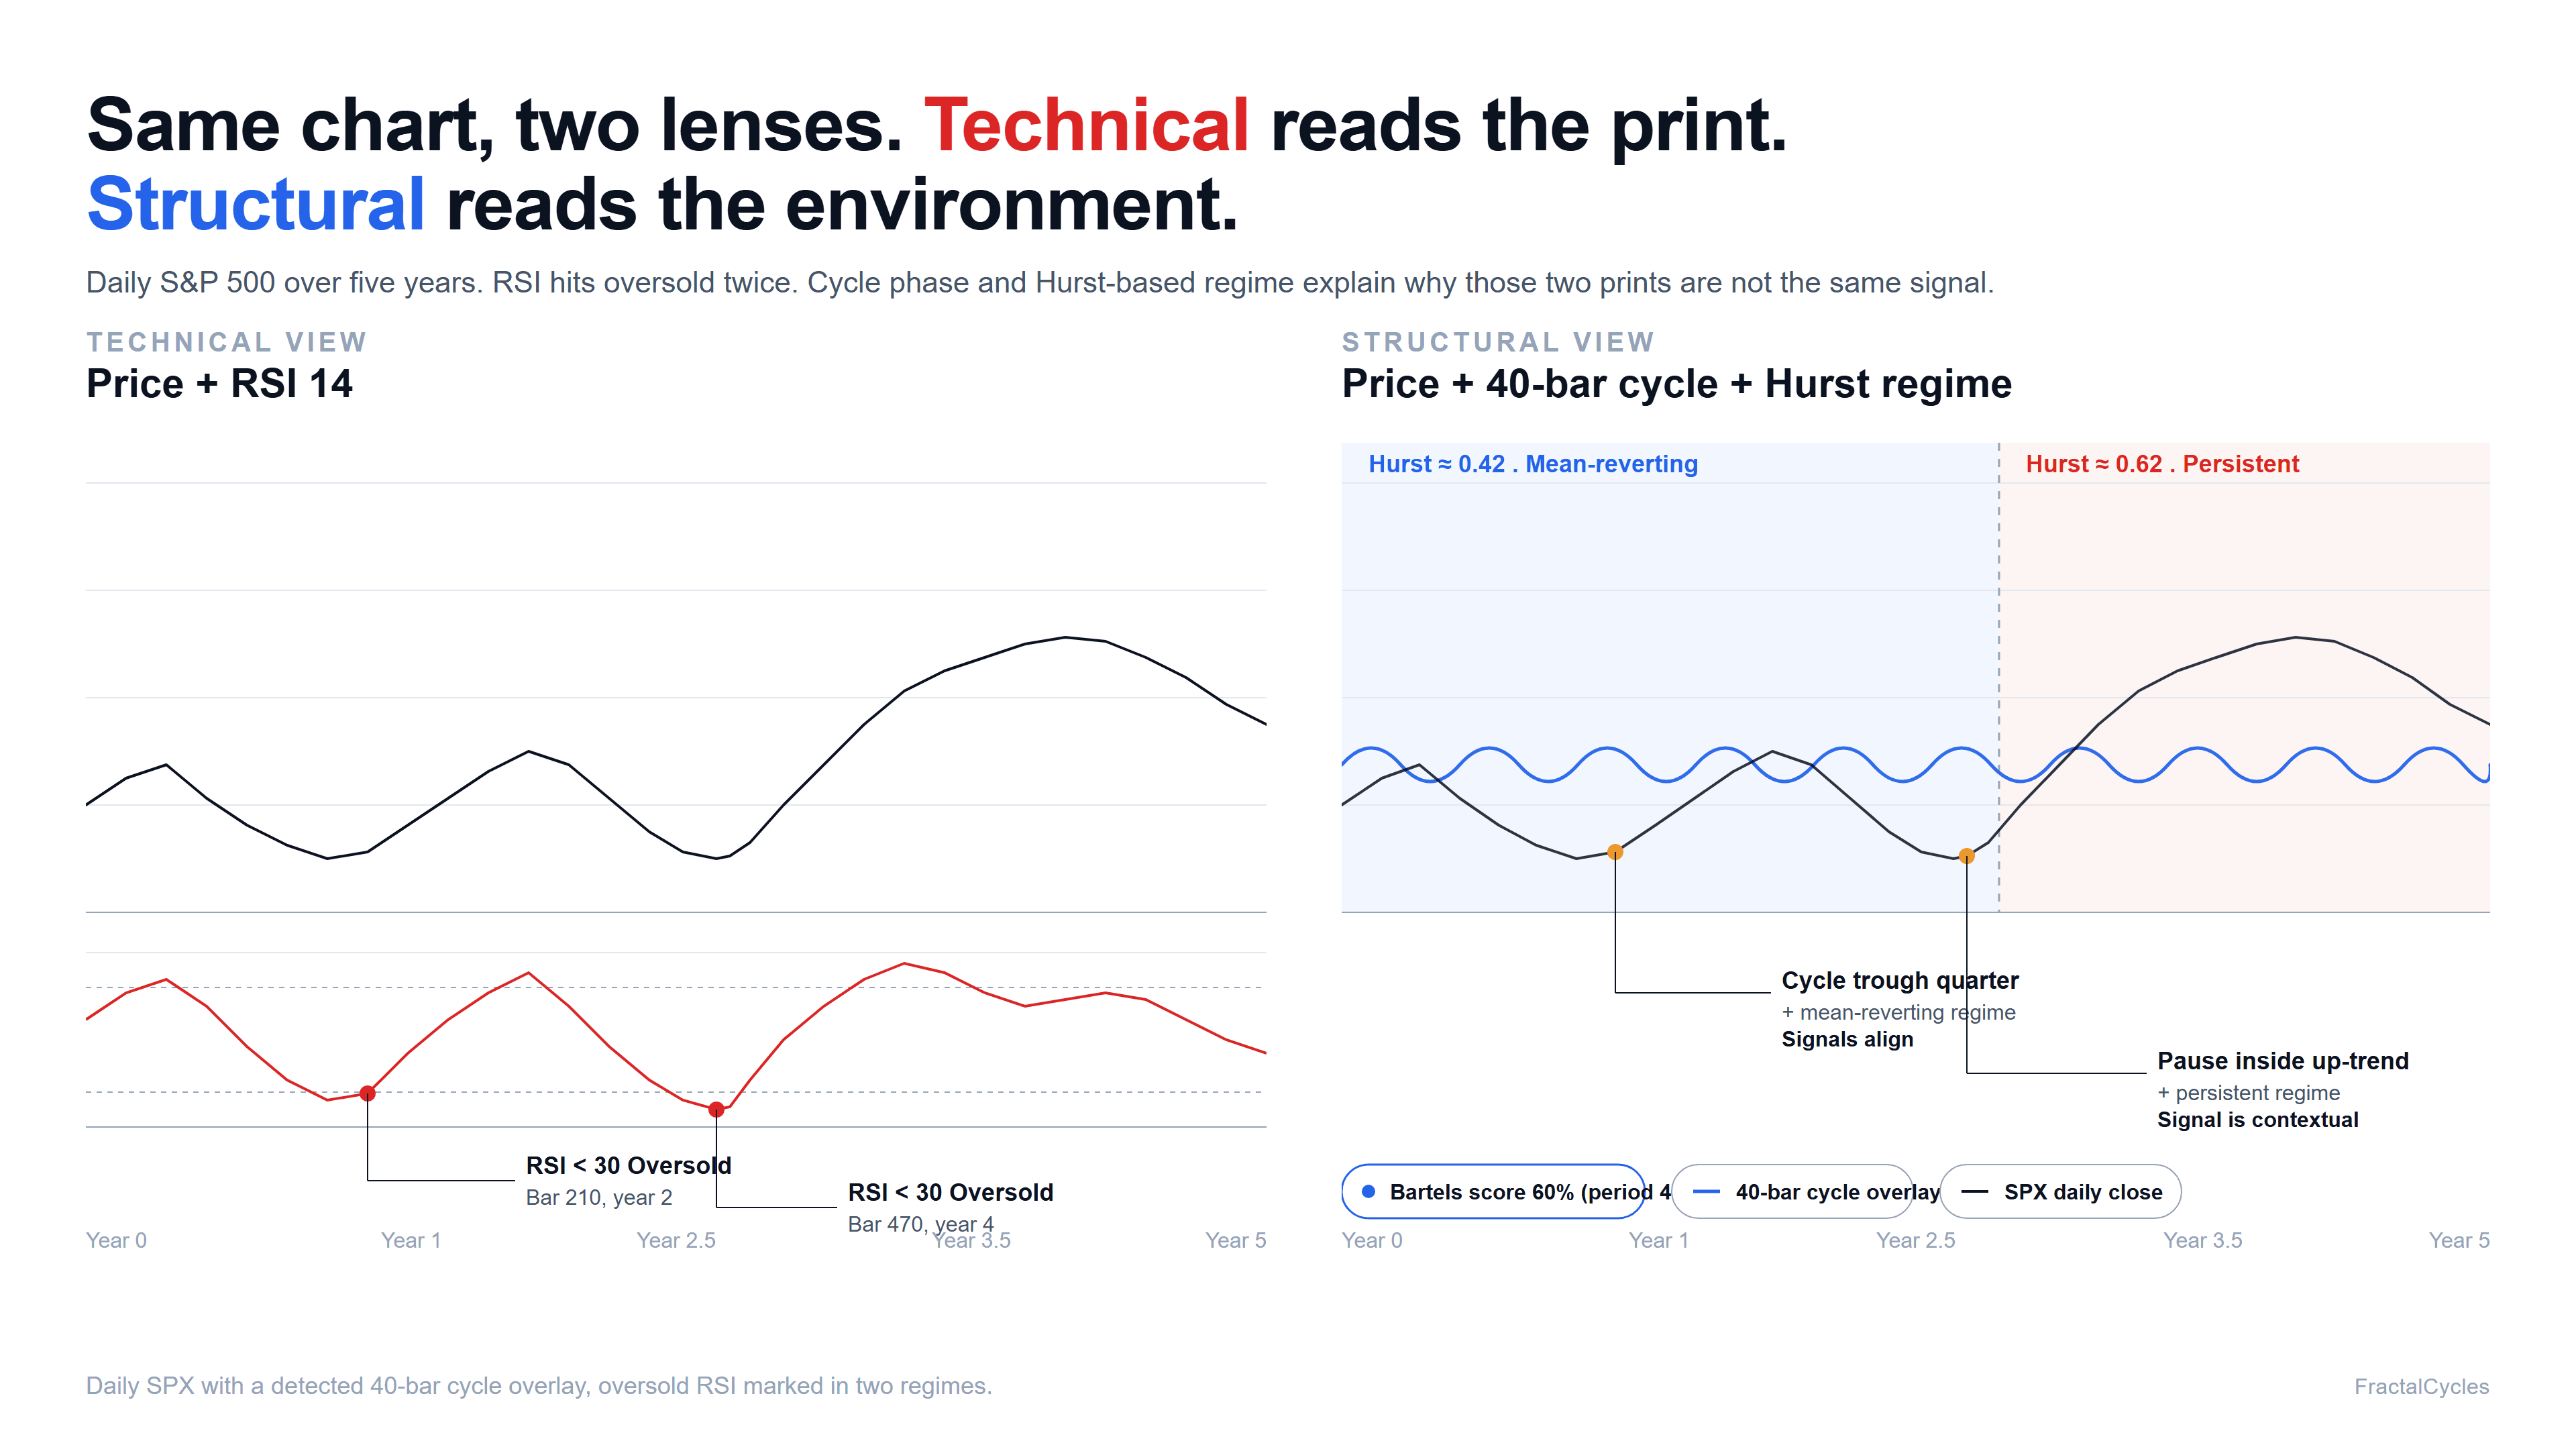
Consider an illustrative five-year window of daily S&P 500 data. A 40-bar cycle (roughly two months) appears with a Bartels significance score of 60% and survives a held-out validation slice. A purely technical view of the same chart shows RSI hitting oversold (below 30) twice in that window. Once during a regime where the rolling Hurst exponent reads 0.42, and once where it reads 0.62.
The technical reading is identical in both cases. The structural reading is not. With Hurst near 0.42 the market favors mean reversion, so an oversold RSI print near the trough quarter of the 40-bar cycle is internally consistent. Cycle phase, regime, and indicator all point the same direction. With Hurst near 0.62 the market favors persistence, so the same oversold print is more likely a pause inside a continuing decline. The structural lens does not tell the technical reading what to do. It tells you which environment the reading is being taken in.
This is the kind of context a single-window indicator cannot supply. RSI was specified by Welles Wilder in 1978 with a fixed 14-period lookback, and that lookback is unrelated to whatever dominant cycle currently drives the instrument. Cycle-aware structural analysis lets the regime determine which technical signals deserve weight, rather than treating every oversold print as equivalent. Readers who want the underlying statistics can review Bartels significance testing and market regime detection, and the same logic applied to a real instrument is illustrated on the S&P 500 market page.
How to Read the Two Frameworks Together
A practical reading order helps avoid mixing the frameworks at the wrong layer. First, identify the regime over a window long enough to be stable. Several months for a daily chart is typical. Second, locate the dominant cycle and its current phase. Only then does it make sense to consult conventional indicators, because their behavior in a trending regime differs sharply from their behavior in a mean-reverting one. The same RSI 30 print is a different signal in each.
Used in this order, the two approaches stop competing. Technical patterns become candidate triggers, and structural analysis decides whether the trigger sits in an environment where it has historically had any edge. That filtering is the practical reason analysts pair the methods, and it is the part that survives the move from chart inspection to systematic testing.
Framework: This analysis uses the Fractal Cycles Framework, which identifies market structure through spectral analysis rather than narrative explanation.
Written by Ken Nobak
Market analyst specializing in fractal cycle structure
Get the Monthly Market Cycle State Report
Free market cycle data for 20+ instruments. Dominant periods, regime shifts, and phase transitions delivered every month.
No spam. Unsubscribe anytime.
Disclaimer
This content is for educational purposes only and does not constitute financial, investment, or trading advice. Past performance does not guarantee future results. The analysis presented describes observable market structure and should not be interpreted as predictions, recommendations, or signals. Always conduct your own research and consult with qualified professionals before making trading decisions.
See cycles in your own data
Apply the Fractal Cycles framework to any market using our analysis tools. Start with a free account.