J.M. Hurst showed that prices move in cycles of related lengths, such as 20 weeks, 40 weeks and 18 months, and that the lows of those cycles tend to line up. The Hurst Tools put his methods on your chart, so you can see where each cycle stands, when its next low is due and how far price has stretched from its cycles. They were released on 28 October 2026 for Pro and Ultra members, and you can read the Hurst Tools release notes.
Every screenshot in this guide comes from the same Apple (AAPL) daily analysis with 900 bars, captured on 2 November 2026. The orange numbers are labels we added to point at each part of the screen.
Step 1
Open the Hurst Tools menu
Open any analysis and click the Hurst Tools button at the top right of the page. The menu groups the tools the way Hurst used them: phasing first, then envelopes, then averages. Each tool has a tick next to it, so you can switch tools on and off and see one at a time or several together.
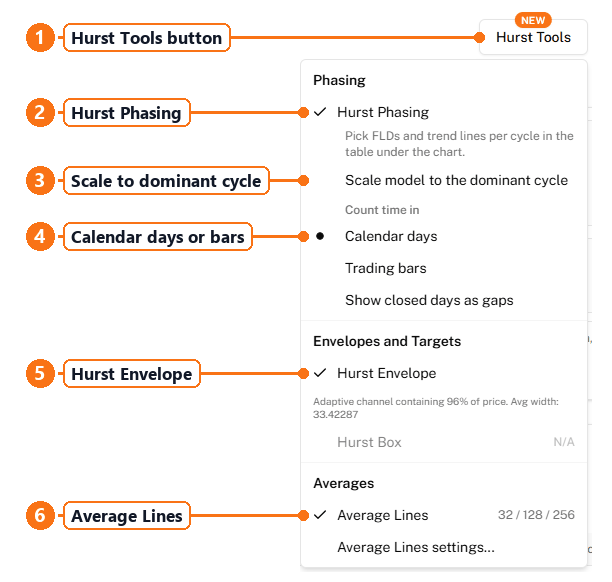
Scale model to the dominant cycle stretches or shrinks the whole cycle model so it fits the strongest cycle in your data, instead of using Hurst's standard lengths. The table under the chart tells you which model you are looking at.
On daily charts you can also choose to count time in calendar days or trading bars. Calendar days follow Hurst's own counts, and with calendar days on you can tick Show closed days as gaps to see weekends and holidays as gaps on the chart.
Step 2
Read Hurst Phasing
Hurst Phasing measures each cycle in your chart and marks every past low with a diamond in that cycle's colour. The diamonds sit in a panel under the price, with the longest cycles at the top, so you can see where the lows of different cycles line up.
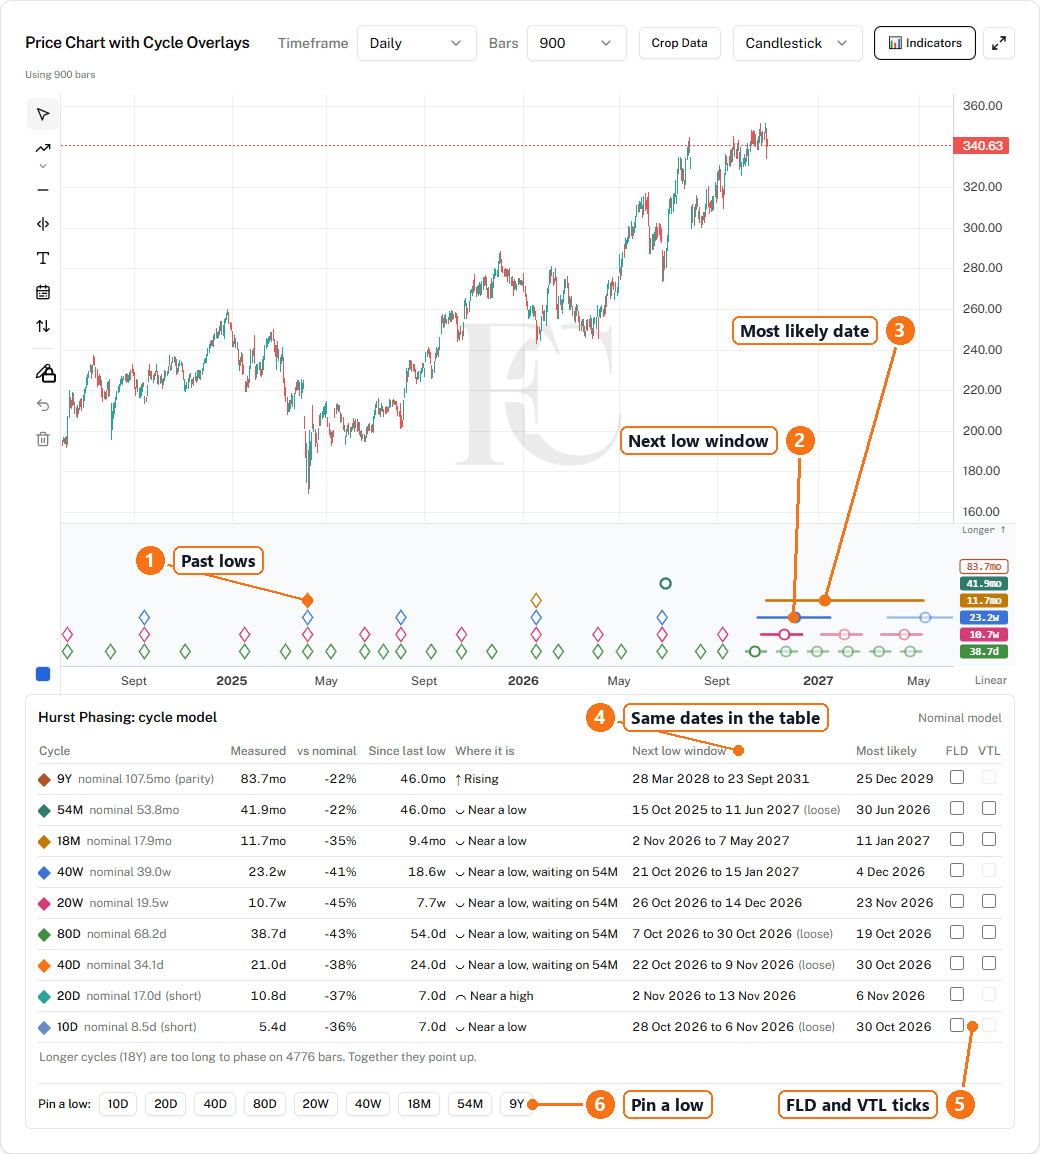
To the right of the last bar, each cycle gets a bar that shows the window where its next low is due, with a circle on the most likely date. Fainter circles further out show the lows after that. You do not need to read dates off the chart, because the table under it lists the same window and date for every cycle.
The table has one row per cycle, from the longest to the shortest:
- Measured is the length the tool found in your data, and vs nominal shows how far that is from Hurst's standard length.
- Since last low is how long ago the cycle last made a low.
- Where it is says whether the cycle is rising, near a high or near a low. "Waiting on 54M" means the low is expected to arrive together with the low of the longer 54 month cycle, as Hurst's lows tend to come in groups.
- Next low window and Most likely give the dates. "Loose" means the most likely date has passed without a new low, so the window stays open.
If you can see a low that the tool missed, use the Pin a low buttons under the table. Pick the cycle, click the chart near the low, and the model is phased again around your pin. Press Esc or the same button to cancel, and use Clear all pins to go back to the tool's own reading.
Step 3
Add an FLD and a VTL
Tick the FLD or VTL box next to any cycle in the phasing table to draw that line on the price chart, in the cycle's colour. Here we ticked both for the 20 week cycle.
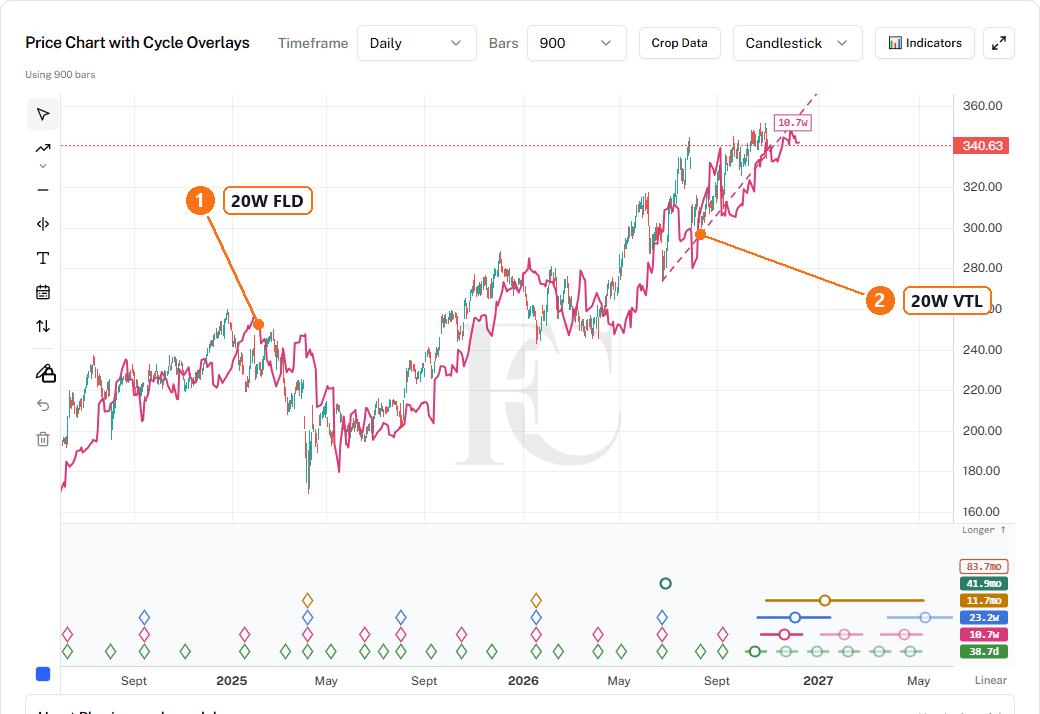
The FLD, or Future Line of Demarcation, is the middle of each bar's range moved forward by half the length of the cycle. The line follows the phasing, so it moves when the measured length of the cycle changes. When price crosses the FLD of a cycle, Hurst read it as a sign that the next longer cycle has turned.
The VTL, or Valid Trend Line, is a straight line through two back to back lows of the cycle when it is rising, or two back to back highs when it is falling. When price crosses the VTL, it is another sign that the next longer cycle has turned. It says nothing about how far price will go. If the VTL box is greyed out, the cycle has no valid line right now, for example because its last two lows do not make one, or because the cycle is too short to draw one.
Step 4
Turn on the Hurst Envelope
Tick Hurst Envelope in the menu to draw bands around price that follow its cycles. If you have not picked any cycles in the Cycle Spectrum, the bands use Hurst's usual lengths of 256, 128 and 32 bars. If you have picked cycles, each band follows one of them.
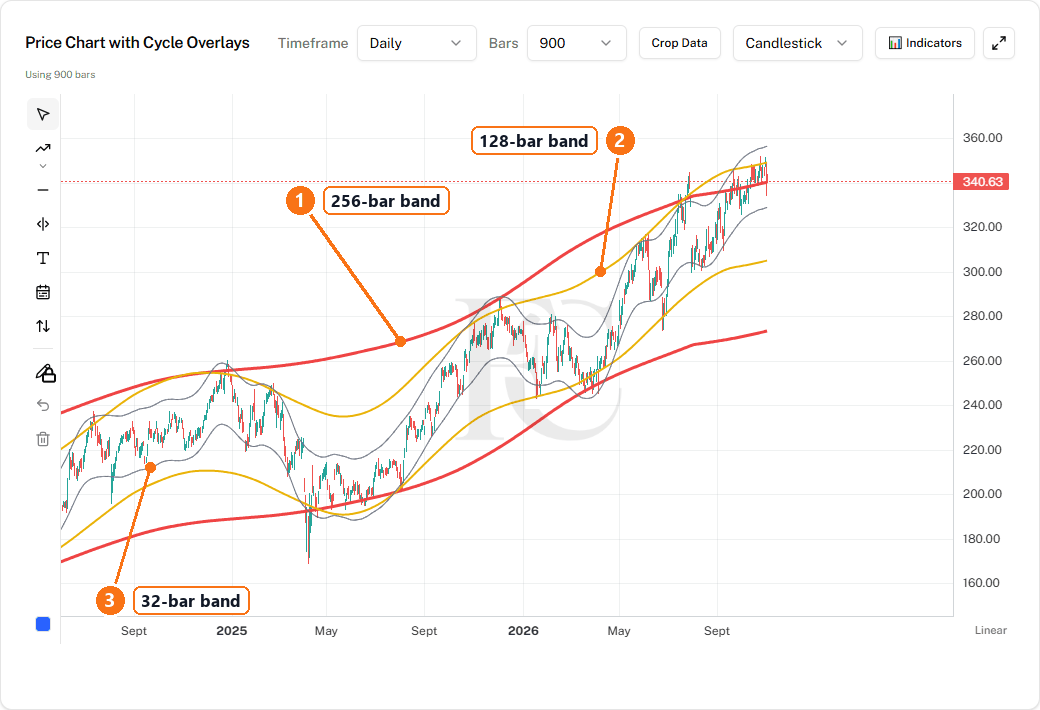
The outer red band is the widest and slowest. When price reaches the edge of a band, it is stretched for that cycle, and that is often where the cycle turns. A touch of the inner band matters for the short cycle. A touch of the red band is a bigger event, because the longest cycle in the chart is stretched too.
Step 5
Use Average Lines
Tick Average Lines to draw centred moving averages of 32, 128 and 256. A centred average is placed over the middle of the prices it averages, which is how Hurst drew them, so the line ends half its length before the latest bar. The 256 average stops furthest back, and the 32 average stops close to the last bar.
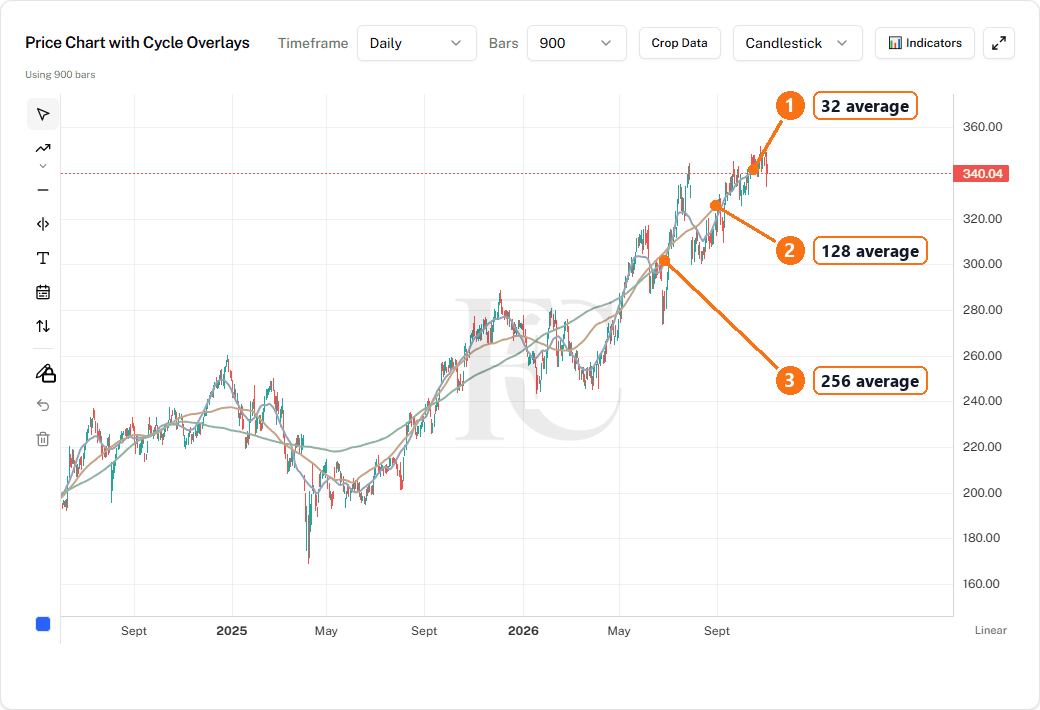
Because a centred average sits over the middle of its prices, it does not lag behind price the way an ordinary moving average does. Each line smooths away the cycles shorter than itself, so the 256 average shows the slow trend and the 32 average shows the shorter swings riding on it. The empty space between the end of each line and the last bar is the part you cannot see yet, which is why the next low windows from Hurst Phasing are useful next to it.
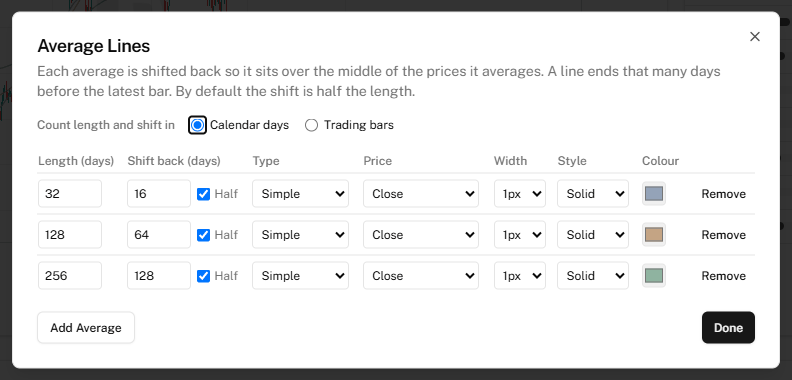
Open Average Lines settings in the menu to change the lengths, the shift, the type of average, the price used, the width, the style and the colour of each line. You can also add another average or remove one.
Step 6
Put the readings together
Each tool answers one question. Hurst Phasing tells you when the next lows are due. The FLD and VTL tell you whether a cycle has turned. The Hurst Envelope tells you how far price has stretched, and the Average Lines show the trend that each cycle rides on. The clearest readings come when they agree, for example when several cycles are inside their next low window, price is near the lower band and then crosses back over a short FLD.
None of this is a signal to buy or sell. That is true of the Hurst Tools, of every other tool on FractalCycles, and of everything we release in the coming months. The tools mark areas of interest and windows where cycle lows have tended to form. Treat them as a cue to pay closer attention, and judge what you see against your own strategy. The decision is always yours.
For the ideas behind these tools, read J.M. Hurst cycles explained. To see how a full Hurst cycle analysis fits together, read how to apply Hurst cycle analysis, and for how FractalCycles compares with other Hurst software, read Hurst cycle software and tools.
On the Free plan?
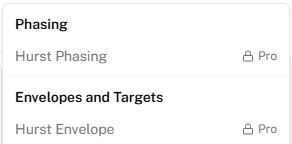
Free members see the Hurst Tools menu with a Pro lock on each tool. Click any of them to see what the upgrade includes.