1. Introduction: the seductive problem
Markets do not move smoothly. Returns cluster, trends arrive in waves, volatility expands and contracts, and certain calendar windows recur often enough that practitioners have named them. Against this backdrop, the temptation to ascribe periodic structure to price is old and persistent. From Wheeler's climatic-cycles work in the 1940s to Dewey's Foundation for the Study of Cycles, popular cycle traditions have proposed dozens of fixed-period rhythms, ranging from the 4-year presidential cycle to the 60-year Kondratieff wave.
The empirical case for periodic structure in markets has a respectable academic anchor. Lo and MacKinlay (1988) rejected the random-walk hypothesis for weekly US stock returns from 1962 to 1985 using a variance-ratio test, with rejection strongest in small-cap portfolios. Fama and French (1988) documented mean-reverting components at three-to-five-year horizons consistent with longer-period structure. These results opened the formal door to cycle research in finance. They did not, however, validate any specific claim of periodicity.
The gap between "returns deviate from a pure random walk" and "markets follow an X-day cycle" is the subject of this paper. Detecting an apparent cycle is easy. A periodogram on any reasonably long series will produce peaks. The hard part is distinguishing a peak that survives a strict null model from a peak that would have appeared by chance even if returns were genuinely independent.
2. The null hypothesis challenge: why random walks look cyclical
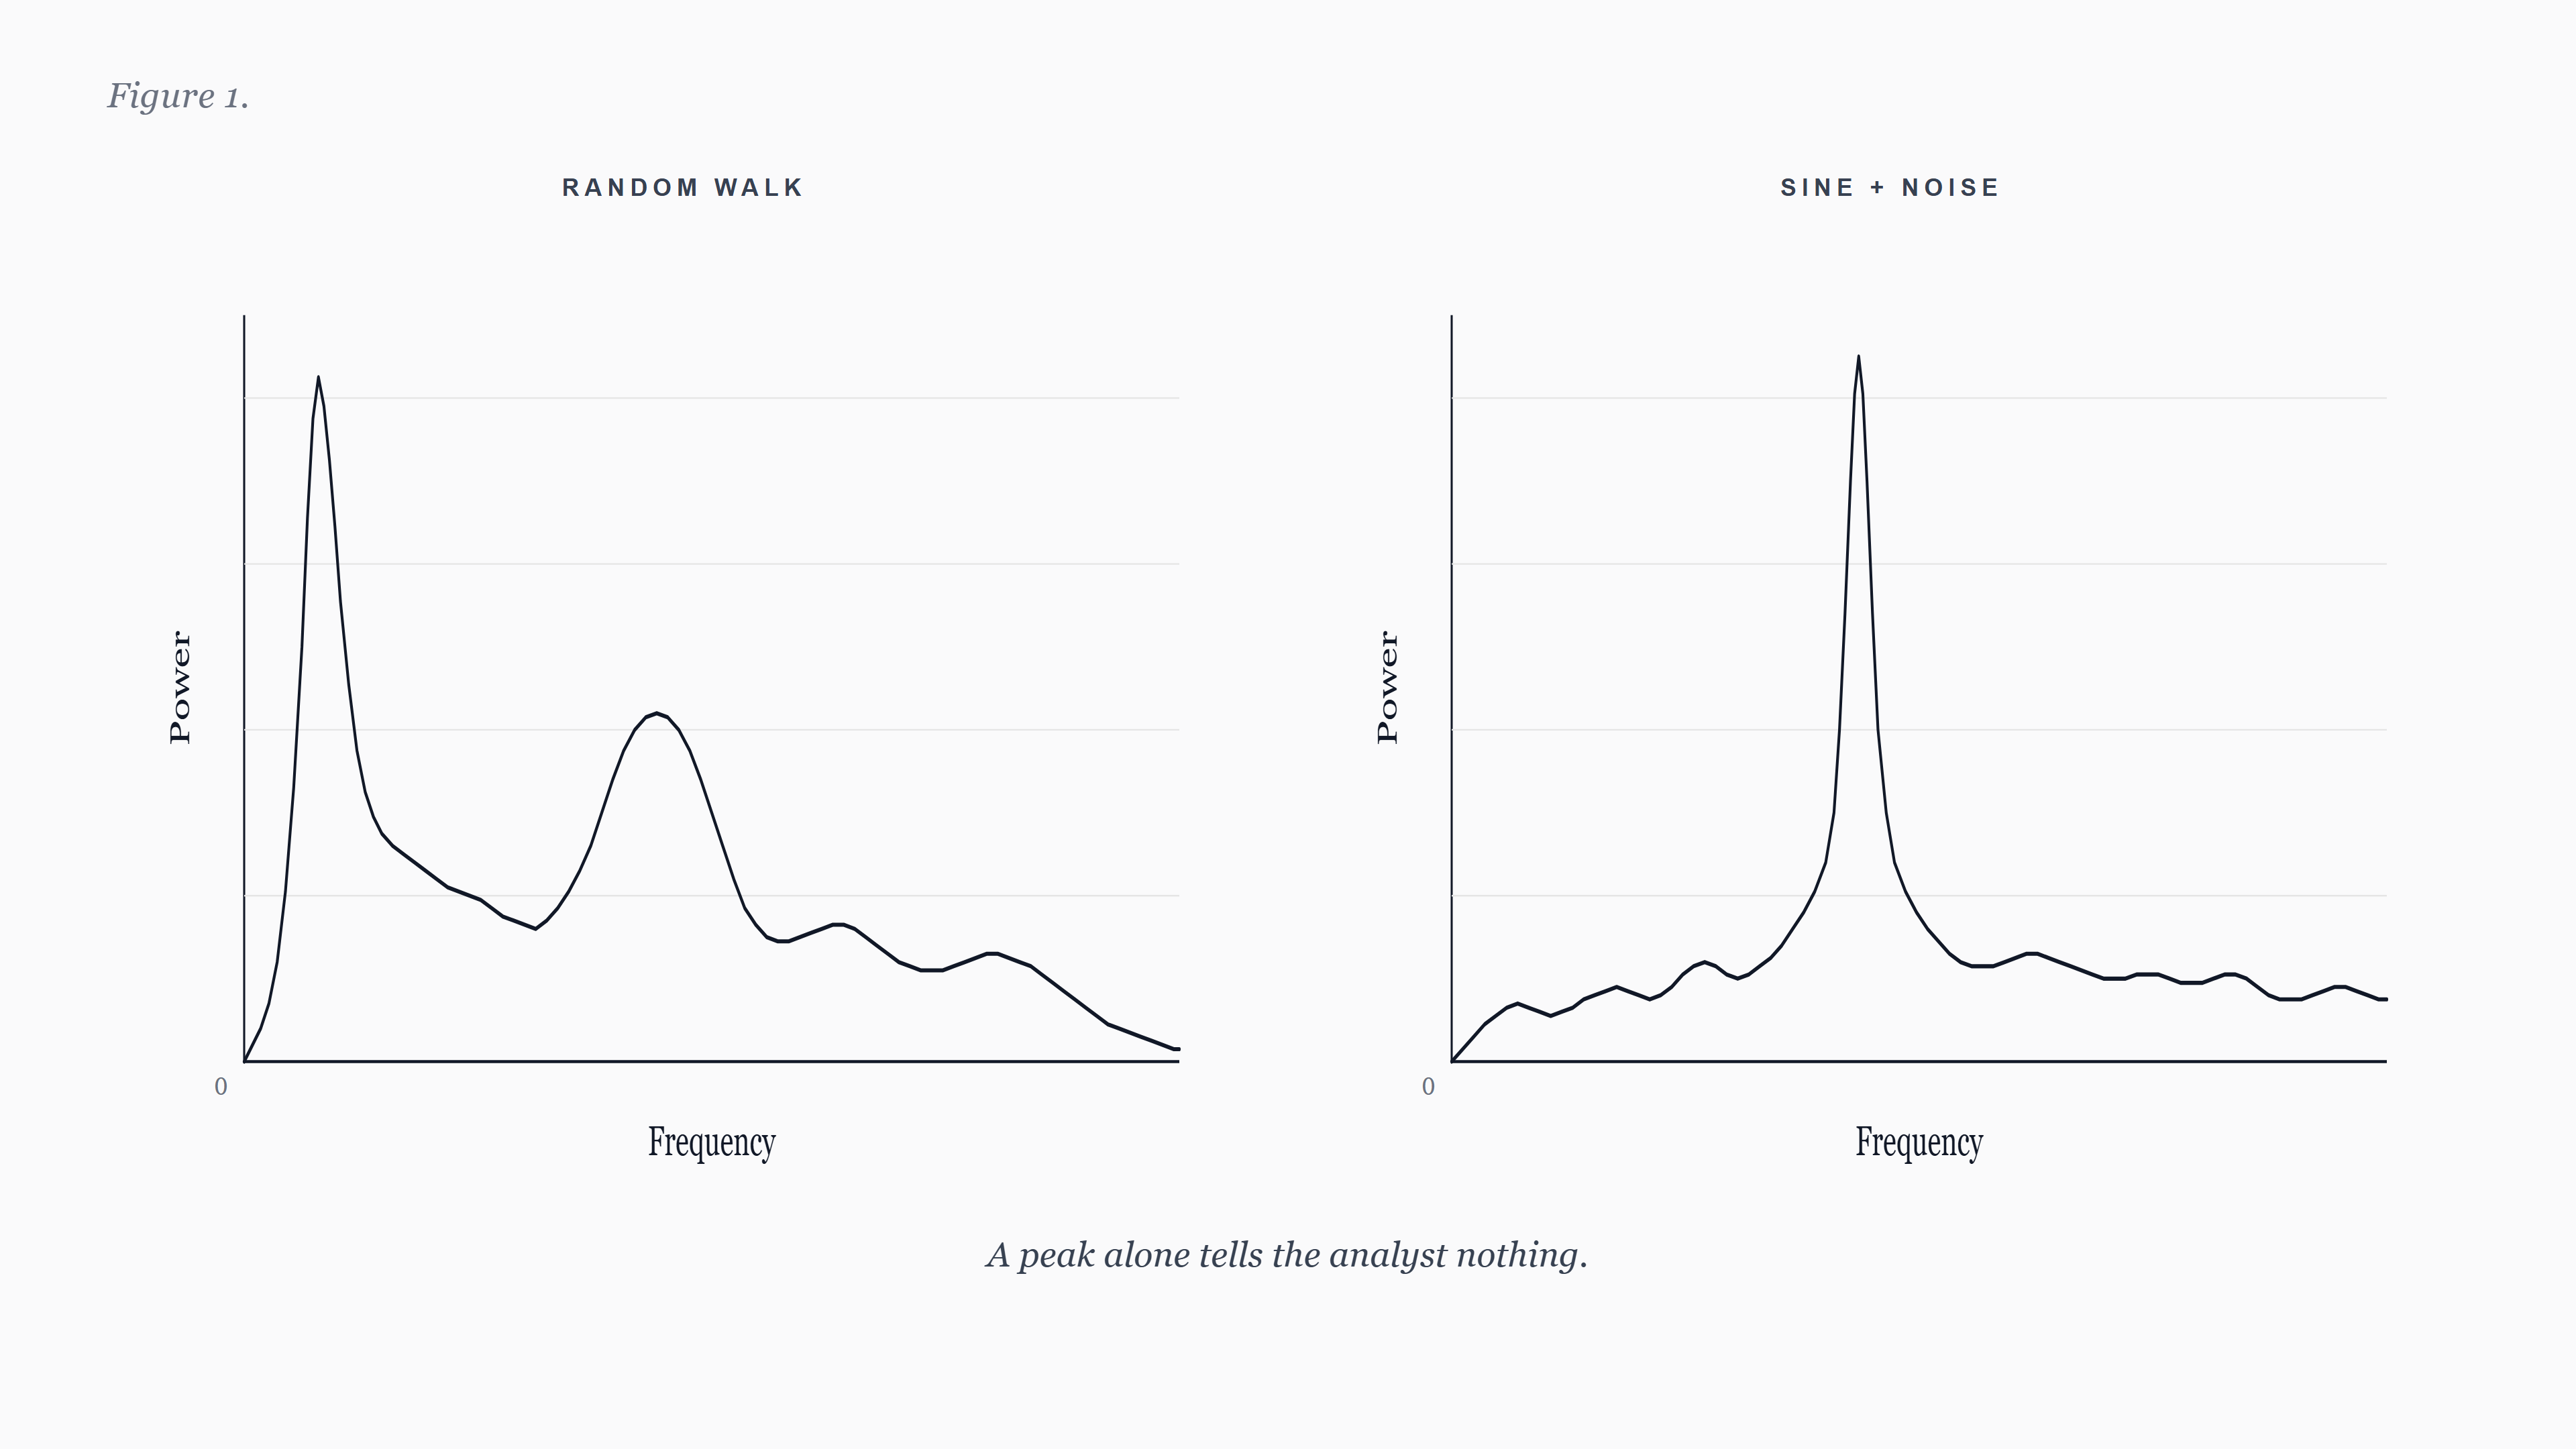
The foundational problem in cycle detection is that finite samples of pure noise produce apparent periodicity. Fisher (1929) made this precise. He showed that under a null of independent Gaussian increments, the largest ordinate of the periodogram has a known distribution that depends only on the sample length. Without a baseline, practitioners systematically over-attribute structure to chance.
The intuition is straightforward. A periodogram decomposes a series into sinusoidal components at evenly spaced frequencies. Even if every observation is independent of every other, some bin will hold the largest power purely by sampling variance. As N grows, the expected maximum bin power grows logarithmically. The periodogram of a random walk, in particular, has substantial low-frequency energy concentrated near zero, which is easily misread as a long cycle.
Granger and Hatanaka (1964) framed this problem as the central challenge of spectral analysis in economics. Priestley (1981, sections 6.2 and 8.4) provides the canonical modern treatment, and Percival and Walden (1993, chapter 9) extends the toolkit with multitaper-based confidence intervals. The recurring theme across forty years of methodology is the same. A cycle claim is a statistical hypothesis. It must be tested against a concrete null, and the test must be calibrated to the data-generating process the analyst believes is plausible in the absence of structure.
3. Three tools, each in isolation
Modern statistical cycle detection in finance does not rely on a single test. It uses tools imported from geophysics, signal processing, and hydrology, each addressing a different aspect of the problem. The three covered below are the most-cited inheritances in the cycle-detection literature outside finance. Each is presented in isolation. Their integration into a working system is a separate question, well outside the scope of this paper.
3.1 Goertzel's narrowband discrete Fourier transform (1958)
Goertzel (1958) published a recursive algorithm for evaluating a single bin of the discrete Fourier transform using a second-order infinite-impulse-response filter. The algorithm computes the Fourier coefficient at one target frequency in O(N) operations, where N is the sample length. The Cooley-Tukey fast Fourier transform (Cooley and Tukey, 1965) computes all N bins simultaneously in O(N log N) operations. For applications in which only a handful of target frequencies are of interest, Goertzel is the computationally preferred choice. Oppenheim and Schafer (2010, section 9.2) covers the modern derivation; Sysel and Rajmic (2012) generalize the algorithm to non-integer multiples of the fundamental frequency, allowing fine-grained period scanning at arbitrary cycle lengths rather than the bin-aligned grid the standard FFT produces.
Goertzel's production-grade application is dual-tone multi-frequency (DTMF) tone detection in telephony, where the receiver scans for a fixed set of tones rather than a full spectrum. The mapping to cycle detection is direct. An analyst with a candidate cycle period in mind can compute its Fourier coefficient in linear time and evaluate its amplitude without paying for a full FFT.
Peer-reviewed applications of the Goertzel algorithm in finance journals are sparse. The technique is well documented in signal processing and engineering, but its lineage in academic finance is short. Practitioner literature is more vocal about its use, but practitioner literature is not the same as peer-reviewed evidence. A defensible framing is that Goertzel is a DSP method ported to finance for narrowband evaluation. It is not itself a significance test.
3.2 Bartels' significance test (1935)
Bartels (1935) introduced what is now called the Bartels test in a 60-page paper on persistence and quasi-persistence of geophysical and cosmical periodicities.1The test compares the observed amplitude of a candidate periodicity at a chosen frequency against the expected amplitude under a null of independent Gaussian noise. Significance is reported via the chi-squared distribution of the harmonic-dial vector lengths.
The test was developed for series that share several properties with financial returns. The geomagnetic series Bartels analyzed exhibited short-range autocorrelation, occasional bursts, and embedded quasi-periodic signals of variable amplitude. Forbush (1982) revisited the framework 47 years later and confirmed that the methodology continued to identify the same recurrence structure that Bartels originally reported.
In finance journals the Bartels test appears rarely under that name. The intellectual lineage is more often described in terms of Fisher's g-statistic (Fisher, 1929) for the largest periodogram ordinate, or in terms of more recent multitaper-based confidence intervals (Percival and Walden, 1993; Thomson, 1982). The Bartels test should be regarded as one option among several rather than as a uniquely correct test, and any cycle claim relying on Bartels alone should also be checked against a complementary test calibrated to colored-noise nulls appropriate to financial data.
3.3 The Hurst exponent (1951) and the Lo (1991) correction
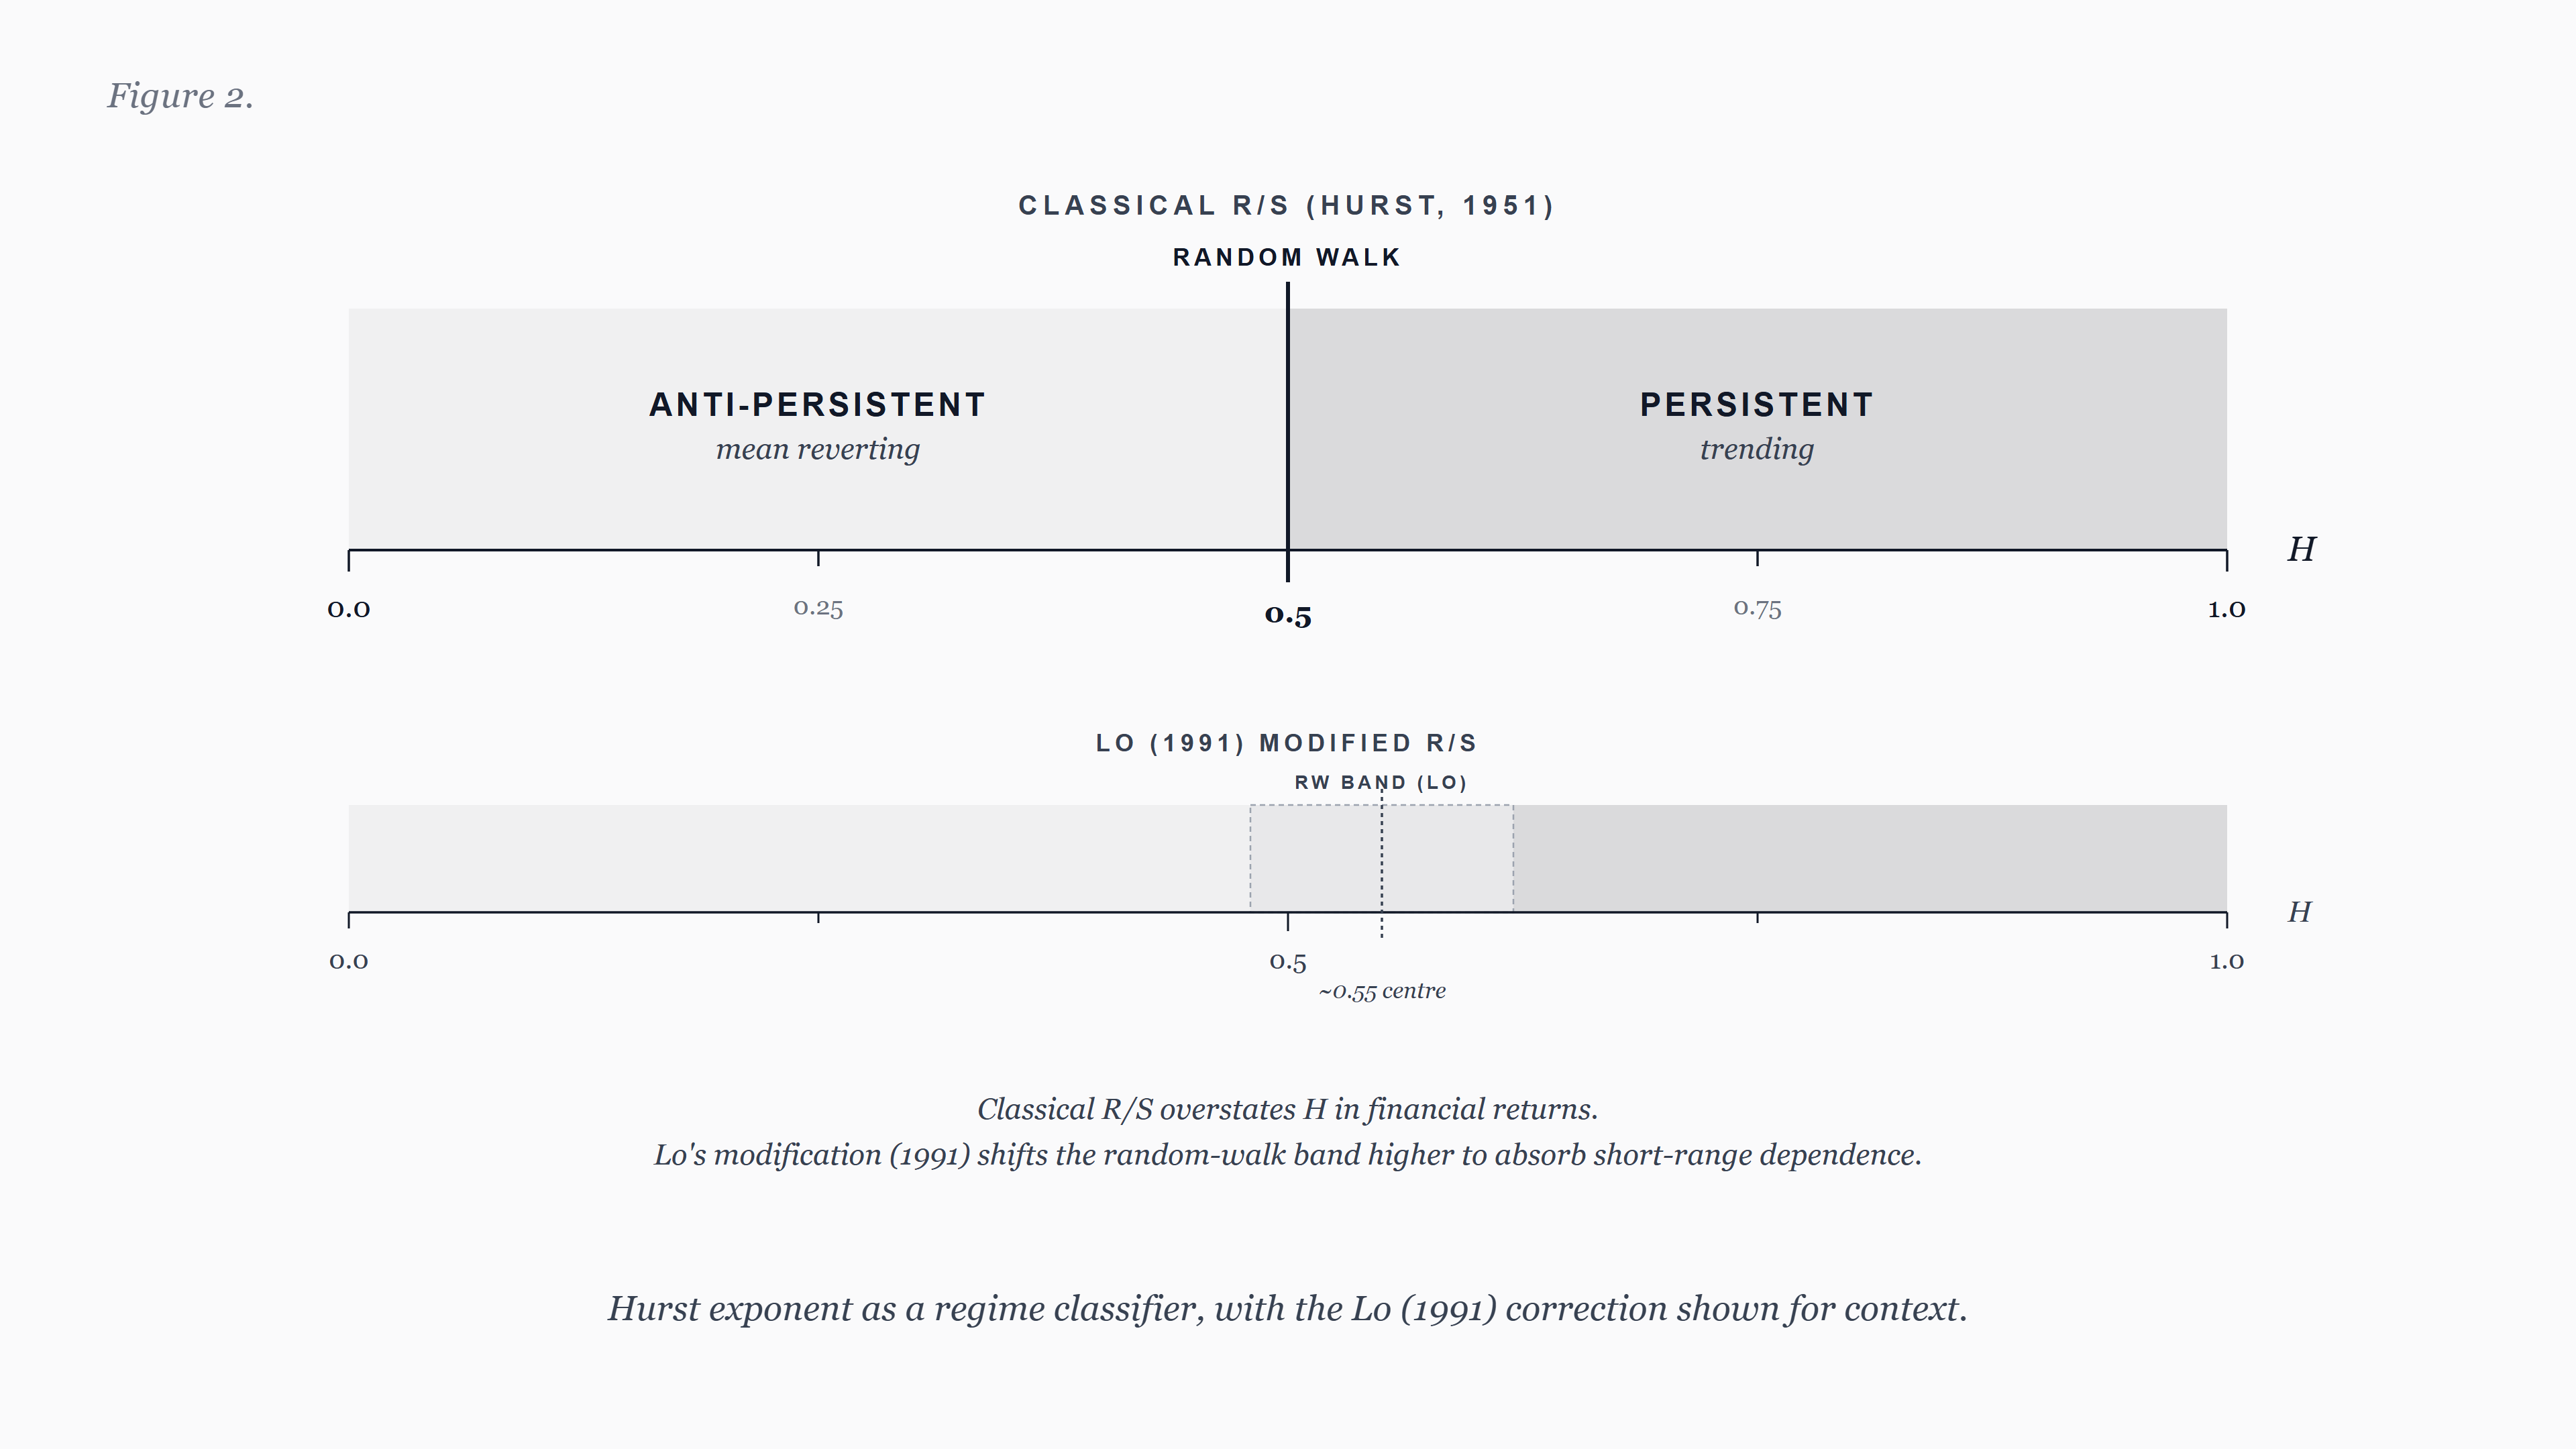
Harold Edwin Hurst (1951) introduced the rescaled-range, or R/S, statistic while sizing Nile reservoirs. Computing R/S over a range of lags s, he found scaling of the form R/S proportional to s raised to the H power, with H near 0.73 in his data. Independent Gaussian increments produce H near 0.5. Persistence in the series lifts H above 0.5, and anti-persistence depresses it below. Mandelbrot and Wallis (1969) generalized the empirical observation to fractional Brownian motion, formalizing H as a long-memory parameter.
Hurst's exponent has a clean interpretation as a regime indicator. Values above 0.5 indicate persistence (returns are positively autocorrelated at the relevant scale). Values below 0.5 indicate anti-persistence (returns mean-revert). Values near 0.5 are consistent with random-walk behavior. As a regime classifier, the exponent is intuitive and empirically tractable.
The classical R/S statistic, however, has a known weakness in financial applications. Lo (1991) showed that R/S over-rejects the random-walk null in the presence of short-range dependence and heteroskedasticity, both of which are routine features of financial returns. Lo proposed a modified R/S statistic robust to those nuisance correlations and applied it to US stock returns. He found no evidence of long-range dependence once short-term autocorrelation was accounted for. Any cycle or regime claim that relies on classical R/S without citing Lo (1991) is incomplete.
A modern alternative is detrended fluctuation analysis (Peng et al., 1994), which removes local polynomial trends within each window and is more robust to non-stationarity. Kantelhardt et al. (2002) extends DFA to a multifractal characterization, which can distinguish long-range correlation from broad-distribution effects. A defensible cycle or regime study reports both classical R/S and at least one of (Lo's modified R/S, DFA), and reconciles any disagreement.
4. The validation gap
Each of the three tools answers a narrow question. Goertzel asks how much energy a candidate cycle period contains. Bartels asks whether that energy is plausibly attributable to noise. Hurst's exponent asks whether the series in which the cycle is sought is even in a regime that supports persistent structure. None of the three is sufficient by itself.
The most common failure mode in published cycle work is the use of a single test, often without a null model appropriate to financial returns, and the reporting of detected cycles without out-of-sample evaluation. A cycle that is significant on the in-sample window must also be checked on data the analyst did not use to choose the candidate period. Skipping this step is the cycle equivalent of in-sample regression R-squared. It is not evidence.
Detrending choices compound the issue. Trend in the level of a series produces low-frequency power that masks or imitates real cycles. Hodrick and Prescott (1997) is the most-cited filter in macroeconomics, but Hamilton (2018) lists four reasons it should not be used: it introduces spurious dynamic relations, end-of-sample values are unstable, the conventional smoothing parameters are not formally defensible, and a regression-based alternative dominates. Any cycle paper that uses HP without citing Hamilton (2018) is incomplete on this point.
For daily and intraday data, the situation is more pragmatic. Neither HP nor Hamilton was designed for the resolution at which much of practical cycle work occurs. First-difference detrending and linear detrending remain defensible defaults at this resolution. Baxter and King (1999) document a band-pass alternative that is sometimes preferable when the analyst's prior on cycle periods is well bounded.
5. What rigorous validation requires
A cycle claim, to be evaluated rigorously, should satisfy several requirements. They are stated here at the methodological level. The specific implementation choices that follow from them depend on the data and on the analyst's choice of null model.
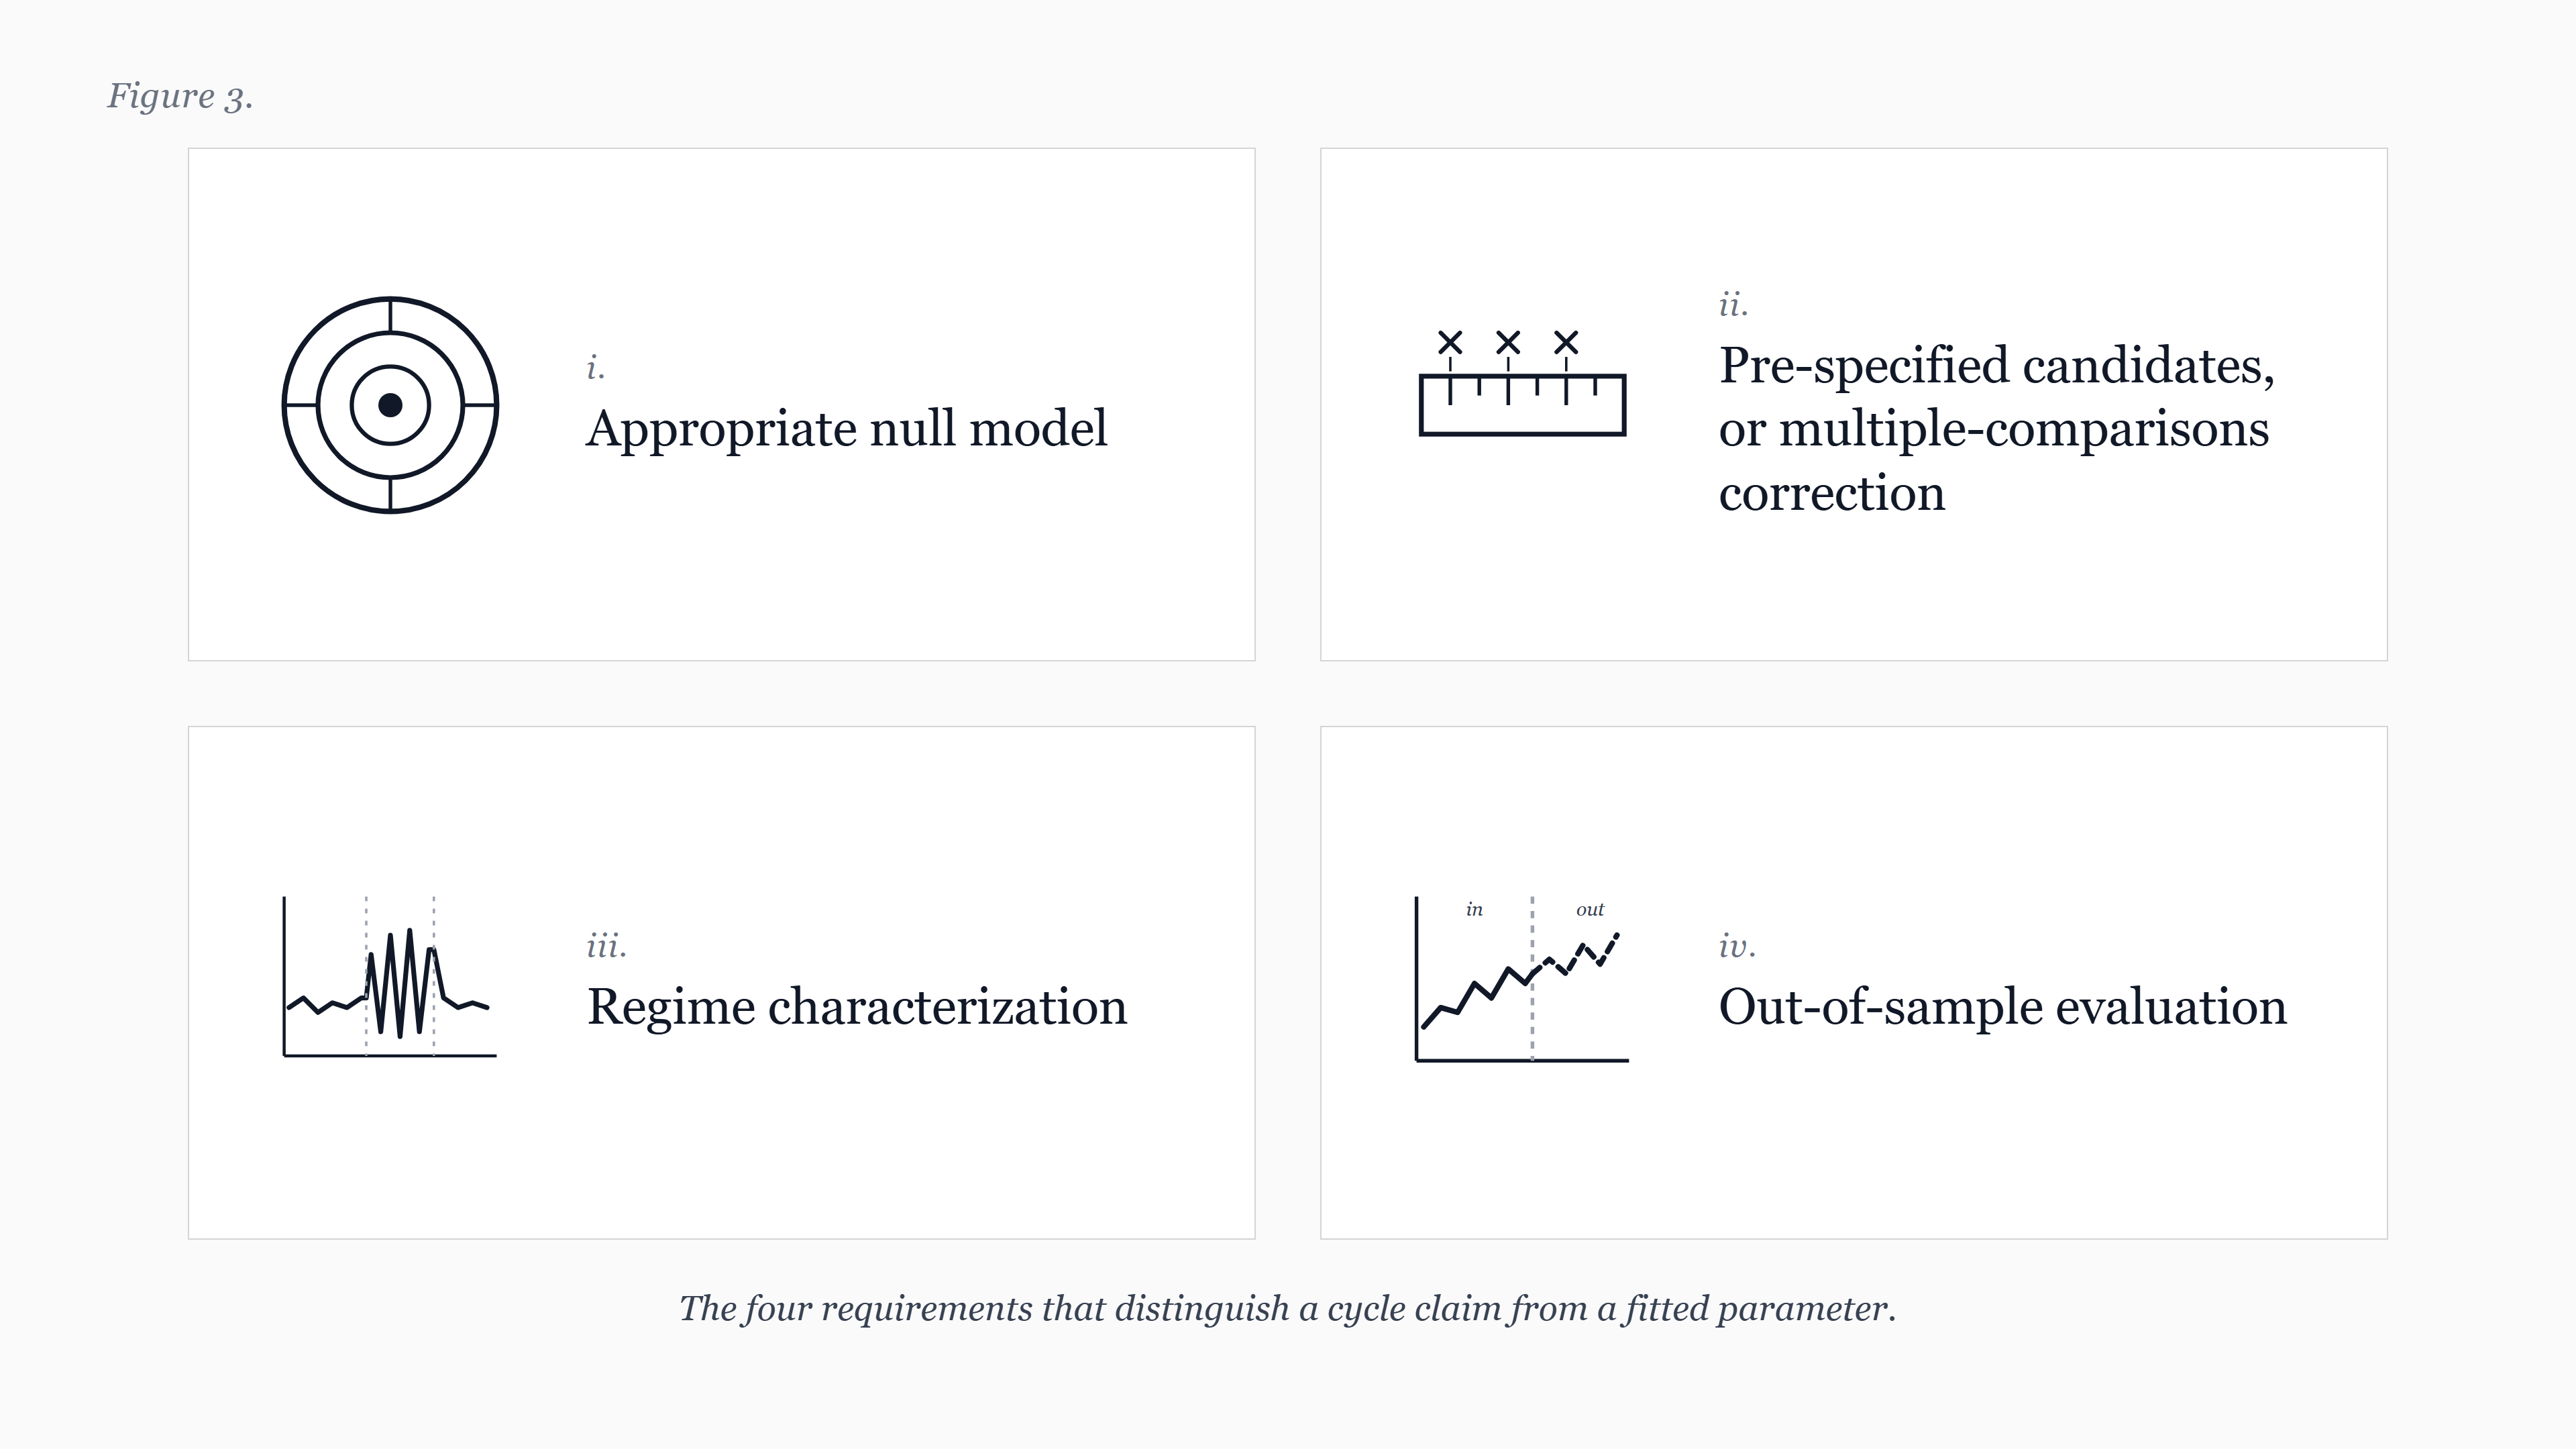
First, the null hypothesis must be appropriate to the data. White-noise nulls are usually too weak for financial returns, which exhibit short-range autocorrelation, volatility clustering, and heavy tails. AR(1) or GARCH-based bootstraps provide more demanding nulls. Reporting which null was used, and why, is part of a complete cycle claim.
Second, the candidate cycle must be specified before the data is examined, or the multiple-comparisons cost must be paid. Scanning a wide range of candidate periods and reporting only the most significant, without adjusting for the search, inflates the implied significance. Bonferroni-style corrections are conservative. False-discovery-rate methods (Benjamini and Hochberg, 1995) are more powerful when the number of candidates is large.
Third, the regime in which the cycle is claimed must be characterized. A persistence reading near or below 0.5 is incompatible with the kind of long-range periodic structure many practitioner systems claim. The same Bartels-significant peak in two different regimes carries different epistemic weight.
Fourth, out-of-sample evaluation is mandatory. A cycle that survives a strict in-sample test but does not hold up on data the analyst did not use to choose the period is not a cycle. It is a fitted parameter.
6. A note on J.M. Hurst's practitioner framework
Within practitioner cycle traditions, the work of J.M. Hurst (1970, 1973) is influential. Hurst proposed that observed prices are the sum of multiple periodicities, that those periodicities are quasi-cyclic rather than strictly periodic, and that nesting and synchronicity properties relate cycles across timeframes. The framework predates modern statistical machinery and sits in the trade-book and course literature, not in peer-reviewed journals.2
Hurst's observations are testable. Treated as cyclic principles to be evaluated against rigorous null models, his framework is a source of structured hypotheses. Treated as conclusions, it is unsupported by the standards of academic finance. The distinction matters. The methodological program advanced in this paper is the appropriate way to evaluate Hurst's practitioner claims, not to inherit them as given.
7. Recommendations and open questions
For researchers, the recommendation is direct. Cycle claims should report the null model, the search procedure and any multiple-comparisons adjustment, the regime context, and the out-of-sample evaluation. Failure to do any of the four should be regarded as inconclusive evidence, not weak evidence.
For practitioners, the recommendation is similar in spirit. A single test is not enough. A practitioner system that reports cycles should report the conditions under which those cycles were validated, the null model against which they were tested, and the regime in which they are believed to apply. Practitioners who present cycle conclusions without these qualifications should be regarded with the same skepticism applied to academic claims that omit them.
For reviewers and journalists, the recommendation is a checklist. When a published or commercial cycle claim arrives, ask which null model was used, how the candidate period was chosen, what regime the data was in at the time, and whether out-of-sample validation was performed. The answers to those four questions are usually enough to separate substantiated work from curve-fitting.
Several questions remain genuinely open. The choice of null model for daily and intraday financial data is under-studied relative to the choice for monthly and quarterly data. The interaction between regime classification and cycle stability is not well characterized. The relative power of Bartels, Fisher's g, and multitaper tests on returns with realistic GARCH structure has been studied less than on idealized data. Each of these is a productive line of work for future research.
8. Conclusion
Detection is not validation. The history of cycle research in finance has accumulated more candidate periodicities than survive scrutiny, and the gap between detection and validation explains much of why. Goertzel, Bartels, and Hurst are useful inheritances, each addressing a different facet of the problem, none sufficient alone. Treating each as a tool, rather than as a conclusion, is the framing this paper recommends.
FractalCycles is one platform that operationalizes statistical cycle validation across a panel of instruments and timeframes, and we expect to publish further methodology notes on the individual components in this series. Our intent with this paper is not to position any single product. It is to consolidate the references that any future cycle claim, ours or otherwise, should be measured against.
Footnotes
1. Industry materials commonly cite Bartels' statistical test as the 1932 paper. The empirical paper on 27-day recurrence in geomagnetic activity is indeed 1932, but the formal statistical test appears in the 1935 paper in Terrestrial Magnetism and Atmospheric Electricity (volume 40, pages 1 to 60, DOI 10.1029/TE040i001p00001). The journal was rebranded as Journal of Geophysical Research by the AGU in 1949. Citations of "Bartels 1932" for the statistical test are technically incorrect.↩
2. Two different people share the surname. Harold Edwin Hurst (1880 to 1978) was a British hydrologist whose 1951 R/S paper introduced what is now called the Hurst exponent. James M. Hurst (active 1960s to 1990s) developed a practitioner cycles framework documented in his 1970 trade book and his 1973 cycles course. The two should never be conflated.↩
References
- Bartels, J. (1935). Random fluctuations, persistence, and quasi-persistence in geophysical and cosmical periodicities. Terrestrial Magnetism and Atmospheric Electricity, 40(1), 1 to 60. DOI: 10.1029/TE040i001p00001.
- Baxter, M., and King, R. G. (1999). Measuring business cycles: approximate band-pass filters for economic time series. The Review of Economics and Statistics, 81(4), 575 to 593. DOI: 10.1162/003465399558454.
- Benjamini, Y., and Hochberg, Y. (1995). Controlling the false discovery rate: a practical and powerful approach to multiple testing. Journal of the Royal Statistical Society, Series B, 57(1), 289 to 300.
- Cooley, J. W., and Tukey, J. W. (1965). An algorithm for the machine calculation of complex Fourier series. Mathematics of Computation, 19(90), 297 to 301. DOI: 10.1090/S0025-5718-1965-0178586-1.
- Fama, E. F. (1970). Efficient capital markets: a review of theory and empirical work. The Journal of Finance, 25(2), 383 to 417. DOI: 10.1111/j.1540-6261.1970.tb00518.x.
- Fama, E. F., and French, K. R. (1988). Permanent and temporary components of stock prices. Journal of Political Economy, 96(2), 246 to 273. DOI: 10.1086/261535.
- Fisher, R. A. (1929). Tests of significance in harmonic analysis. Proceedings of the Royal Society of London, Series A, 125(796), 54 to 59. DOI: 10.1098/rspa.1929.0151.
- Forbush, S. E. (1982). Random fluctuations, persistence, and quasi-persistence in geophysical and cosmical periodicities: a sequel. Reviews of Geophysics, 20(4), 971 to 980. DOI: 10.1029/RG020i004p00971.
- Goertzel, G. (1958). An algorithm for the evaluation of finite trigonometric series. The American Mathematical Monthly, 65(1), 34 to 35. DOI: 10.2307/2310304.
- Granger, C. W. J., and Hatanaka, M. (1964). Spectral analysis of economic time series. Princeton Studies in Mathematical Economics, number 1. Princeton University Press.
- Hamilton, J. D. (2018). Why you should never use the Hodrick-Prescott filter. The Review of Economics and Statistics, 100(5), 831 to 843. DOI: 10.1162/rest_a_00706.
- Hodrick, R. J., and Prescott, E. C. (1997). Postwar U.S. business cycles: an empirical investigation. Journal of Money, Credit and Banking, 29(1), 1 to 16. DOI: 10.2307/2953682.
- Hurst, H. E. (1951). Long-term storage capacity of reservoirs. Transactions of the American Society of Civil Engineers, 116(1), 770 to 799. DOI: 10.1061/TACEAT.0006518.
- Hurst, J. M. (1970). The profit magic of stock transaction timing. Prentice-Hall, Englewood Cliffs, NJ. ISBN 978-0137260003.
- Hurst, J. M. (1973). Cyclitec cycles course. Cyclitec Services. (Reissued by Traders Press, ISBN 978-0934380461.)
- Kantelhardt, J. W., Zschiegner, S. A., Koscielny-Bunde, E., Havlin, S., Bunde, A., and Stanley, H. E. (2002). Multifractal detrended fluctuation analysis of nonstationary time series. Physica A, 316(1 to 4), 87 to 114. DOI: 10.1016/S0378-4371(02)01383-3.
- Lo, A. W. (1991). Long-term memory in stock market prices. Econometrica, 59(5), 1279 to 1313. DOI: 10.2307/2938368.
- Lo, A. W., and MacKinlay, A. C. (1988). Stock market prices do not follow random walks: evidence from a simple specification test. The Review of Financial Studies, 1(1), 41 to 66. DOI: 10.1093/rfs/1.1.41.
- Mandelbrot, B. B., and Wallis, J. R. (1969). Some long-run properties of geophysical records. Water Resources Research, 5(2), 321 to 340. DOI: 10.1029/WR005i002p00321.
- Oppenheim, A. V., and Schafer, R. W. (2010). Discrete-time signal processing (3rd edition). Prentice Hall. ISBN 978-0131988422.
- Peng, C.-K., Buldyrev, S. V., Havlin, S., Simons, M., Stanley, H. E., and Goldberger, A. L. (1994). Mosaic organization of DNA nucleotides. Physical Review E, 49(2), 1685 to 1689. DOI: 10.1103/PhysRevE.49.1685.
- Percival, D. B., and Walden, A. T. (1993). Spectral analysis for physical applications. Cambridge University Press. ISBN 978-0521435413.
- Priestley, M. B. (1981). Spectral analysis and time series (volumes I and II). Academic Press. ISBN 978-0125649223.
- Sysel, P., and Rajmic, P. (2012). Goertzel algorithm generalized to non-integer multiples of fundamental frequency. EURASIP Journal on Advances in Signal Processing, 2012(56). DOI: 10.1186/1687-6180-2012-56.
- Thomson, D. J. (1982). Spectrum estimation and harmonic analysis. Proceedings of the IEEE, 70(9), 1055 to 1096. DOI: 10.1109/PROC.1982.12433.