In 1970 an engineer named J.M. Hurst published The Profit Magic of Stock Transaction Timing, and its central claim was simple and bold. Price movement, he argued, is not random noise, because it is the sum of many regular waves of different lengths, and so if you can work out where those waves are, you can judge when a turn is due far more carefully than by guessing. More than fifty years later his tools are still used by cycle analysts around the world. This article puts the most useful of them into one Hurst cycle trading strategy, which means finding where the cycles are, waiting for the right one to bottom, using a clear trigger, projecting how far the move may run, and knowing when it is over. Every step is shown on a real chart from FractalCycles, which now draws all of these tools for you.
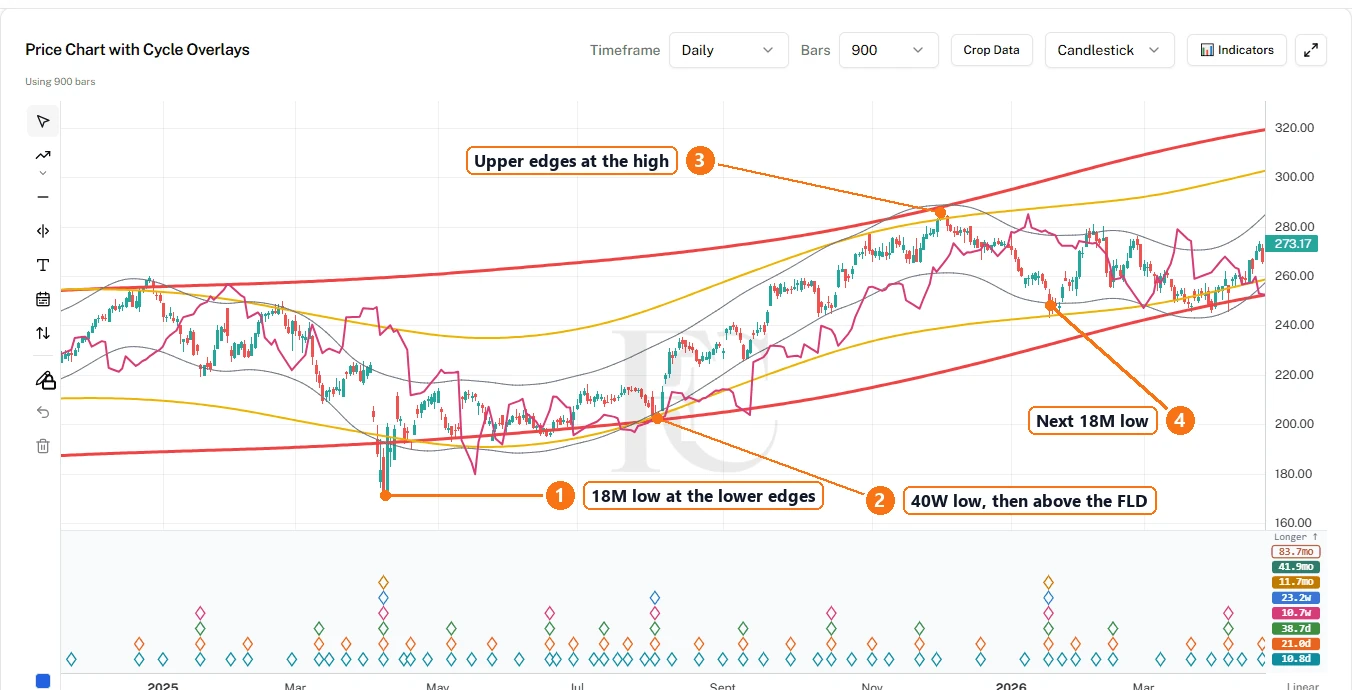
The screenshots come from the Hurst Tools in FractalCycles, drawn on Apple (AAPL) daily prices to late October 2026 with 900 bars on screen, and the numbered labels were added afterwards to point out what each tool is showing. Figures 1 and 2 are drawings that explain the theory, so they show no real market. The Apple charts are there to show how each tool behaves on past prices, and none of them is a forecast for Apple.
The ideaThe principles underneath it all
Hurst organised his thinking into a handful of principles. You do not need to memorise them, but they explain why each of the tools that follow works the way it does.
| Principle | What it means in practice |
|---|---|
| Summation | Price is the sum of several cycles plus a trend, so once you separate the waves the chart starts to make sense. |
| Harmonicity | Neighbouring cycles relate by small whole numbers, usually two and sometimes three. |
| Synchronicity | Cycles tend to bottom together, so a big low is also a low of every smaller cycle. |
| Proportionality | Longer cycles have bigger swings, so knowing which cycle you are watching tells you roughly how far it can move. |
| Nominality | A common set of cycle lengths shows up across markets, which gives you a starting template. |
| Variation | Real cycles drift around their nominal lengths, so the template is a guide rather than a clock. |
Two of these principles matter most for the rest of this article. Summation says that the chart you see is several waves stacked on top of each other, and synchronicity says that those waves tend to bottom together, which is why the deepest lows on a chart are usually the places where several cycles turn up at once.
Three waves add up to one price line
The templateThe nominal model
Hurst's nominal model lists the cycle lengths he found repeating across markets. Each cycle is roughly half the length of the one above it, except for one step of three between the 54-month and 18-month waves. The names are labels rather than exact lengths, so the cycle called 80 days averages about 68 calendar days in his model, and the one called 20 weeks averages about 19.5 weeks.
Most daily-chart work happens in the band from the 20-day cycle up to the 20-week cycle, because those cycles are long enough to matter and short enough to repeat often.
Hurst's nominal model
Real cycles drift around these lengths, and that is the sixth principle, variation, at work. On the Apple chart used in this article, the cycles that FractalCycles measured run between about a fifth and almost a half shorter than their nominal lengths, which is why the model works as a way of naming cycles rather than as a clock.
Step 1Phasing: find where the cycles are
Everything else in this plan depends on phasing, so it comes first. Phasing means marking the lows of each cycle on the chart and checking that they fit together. You start with the most obvious major lows and label them as the longest cycle you can see, and then you work down, because halfway between two major lows there should be a lesser low, halfway between those a smaller one again, and so on.
A good phasing has three signs. The lows fall close to their expected spacing, the larger lows sit exactly on top of smaller ones, and the swings between lows are roughly in proportion to each cycle's length. When all three are true you have a map, and every tool that follows reads off that map.
Done by hand, phasing is slow and it takes judgement, which is why it is the step most people skip. FractalCycles does it for you with Hurst Phasing, which marks the past lows of every cycle it finds, checks that they nest, and shows the window where each cycle's next low would fall if it keeps its recent rhythm.
Hurst Phasing on a real chart
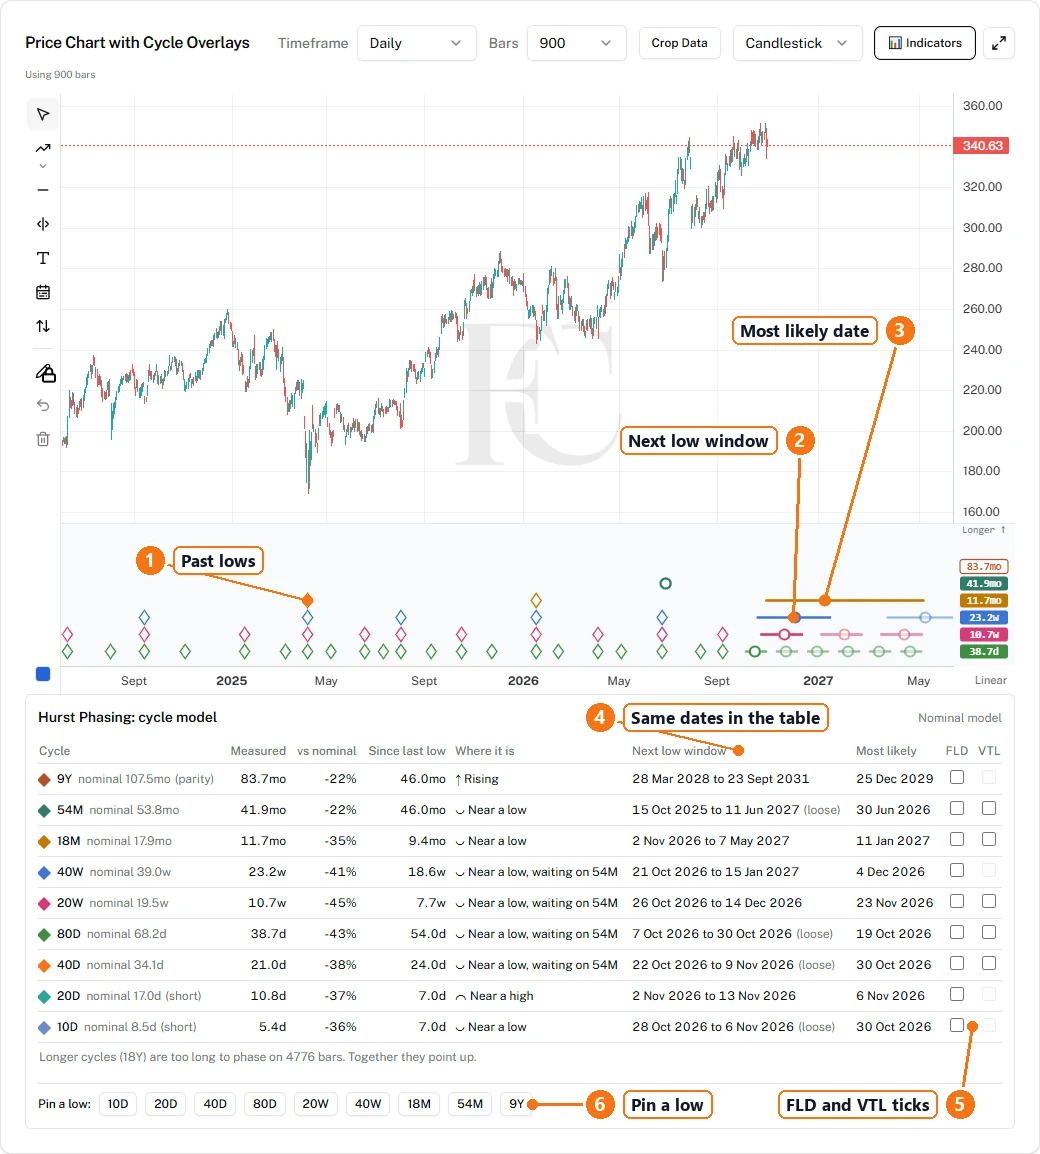
Phase from the top down rather than from the bottom up, because big lows are easier to spot and they anchor everything beneath them. Count the smaller lows inside each larger wave, where two or three is normal, and a count of one or five usually means something has been labelled wrongly. Revisit the phasing whenever a new low forms, because it is a living map rather than a one-off exercise.
Step 2Centred averages and envelopes: see the next low coming
A centred moving average plots each average at the middle of its window rather than at the end. That removes the lag you get with an ordinary moving average, so the line traces a cycle faithfully, and if you choose a span close to the cycle you want to filter out, what remains is the longer wave beneath it. The cost of that accuracy is that a centred average stops half a span before the latest bar, because the bars that would centre it have not happened yet, and Hurst's answer was to extend the curve by eye along its recent path.
Draw a band of constant width around that average and you get an envelope. Price tends to touch the lower edge at lows of the smaller cycle and the upper edge at highs, so the envelope turns your phasing into a picture of where, and roughly when, the next low should form.
The Hurst Envelope in FractalCycles draws three bands at once, built on spans of 256, 128 and 32 bars, so a long, a medium and a short wave can be read together on one chart. Centred Average Lines are there as well, for when you want the averages without the bands.
The Hurst Envelope around two 18-month lows
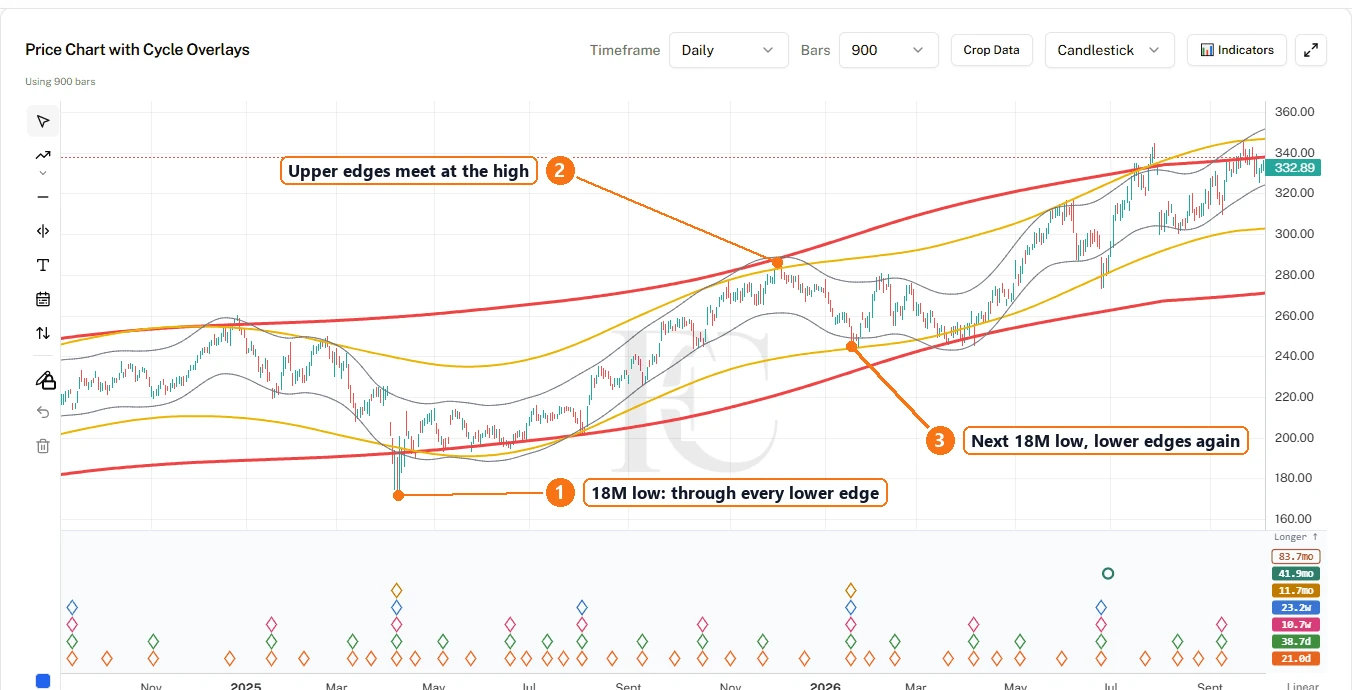
Step 3The FLD: trigger and target
The Future Line of Demarcation, or FLD, is the most practical tool Hurst gave us, and it is simple to build. You take the middle of each bar, halfway between its high and its low, and shift that line forward by half the length of the cycle, plus one bar. Because the FLD is price displaced by half a cycle, it acts like a mirror of where that cycle has just been.
The rule that makes it useful is easy to get wrong. A cross of a cycle's FLD tells you about the next longer cycle, so price crossing up through the 20-week FLD is the evidence that the 40-week cycle has made its low, and a cross down through it suggests that the 40-week cycle has topped. In FractalCycles the FLD follows the phasing, which means each line is built from the cycle length measured on your own chart rather than from the nominal one.
The 20-week FLD through the 2025 lows
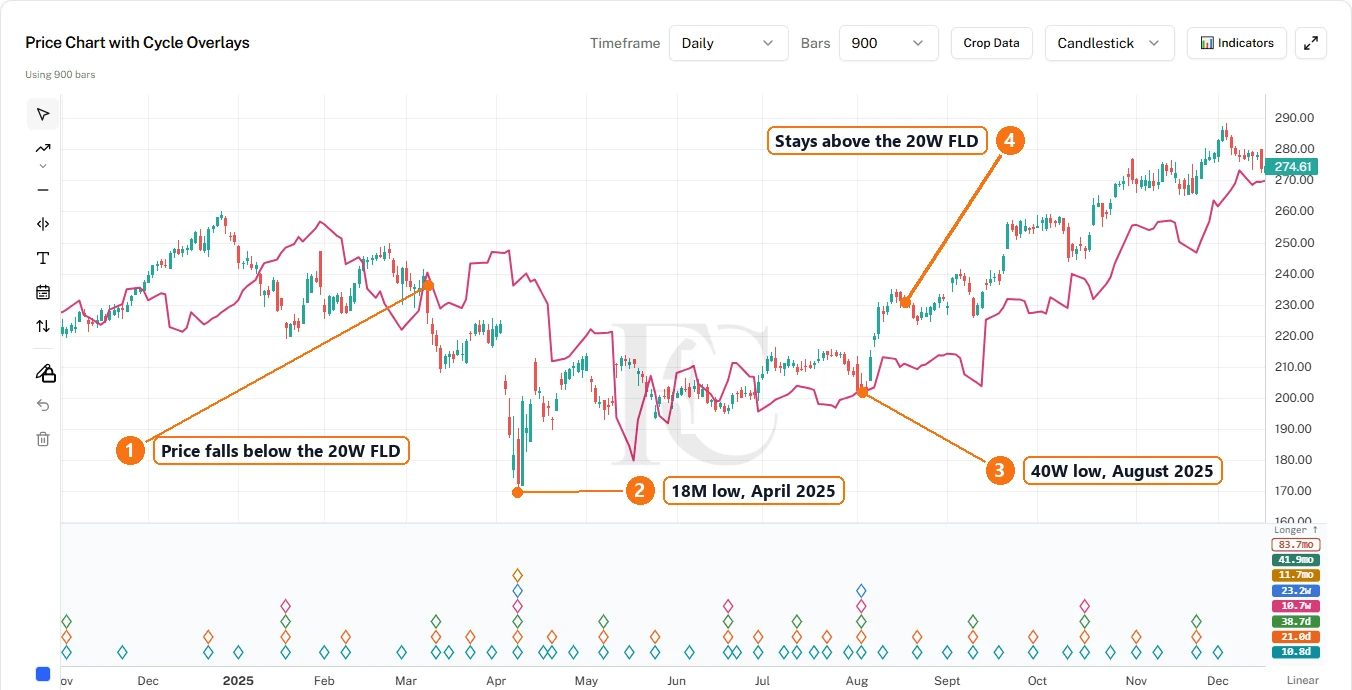
Hurst found that an FLD cross tends to come about halfway through the swing. So you measure the distance from the low to the price where the cross happens, and then add the same distance again above the cross, which gives an estimate of how far the move may run. Downside targets work the same way in reverse, measured from the high before the cross.
Treat the result as a zone rather than an exact price, because Hurst himself noted that targets tend to be overshot when the larger trend is moving the same way and to fall short when it is moving against the move.
It also helps to plot FLDs for two or three neighbouring cycles, such as the 40-day, 80-day and 20-week lines. When price crosses them one after another, several cycles are turning together, which is synchronicity at work, and the targets they give tend to cluster, which makes the area they point to more dependable than any single projection. Before a cross, an FLD often acts as support or resistance as well, so the way price behaves as it nears the line tells you a good deal about what may come next.
Step 4Valid trend lines: confirm the turn
Hurst's trend lines are stricter than the ones most people draw. A valid trend line joins two lows of the same cycle that sit inside the same wave of the next longer cycle, and price must not cross the line between those two points. You draw it, extend it forward, and wait.
When price closes down through a rising VTL, that confirms the next longer cycle has already peaked and is heading for its low, and when price closes up through a falling VTL drawn across two highs, that confirms the next longer cycle has made its low. FractalCycles draws both lines for the current wave of each cycle you switch on, so you can watch them without measuring anything by hand.
The live 20-week VTL on Apple
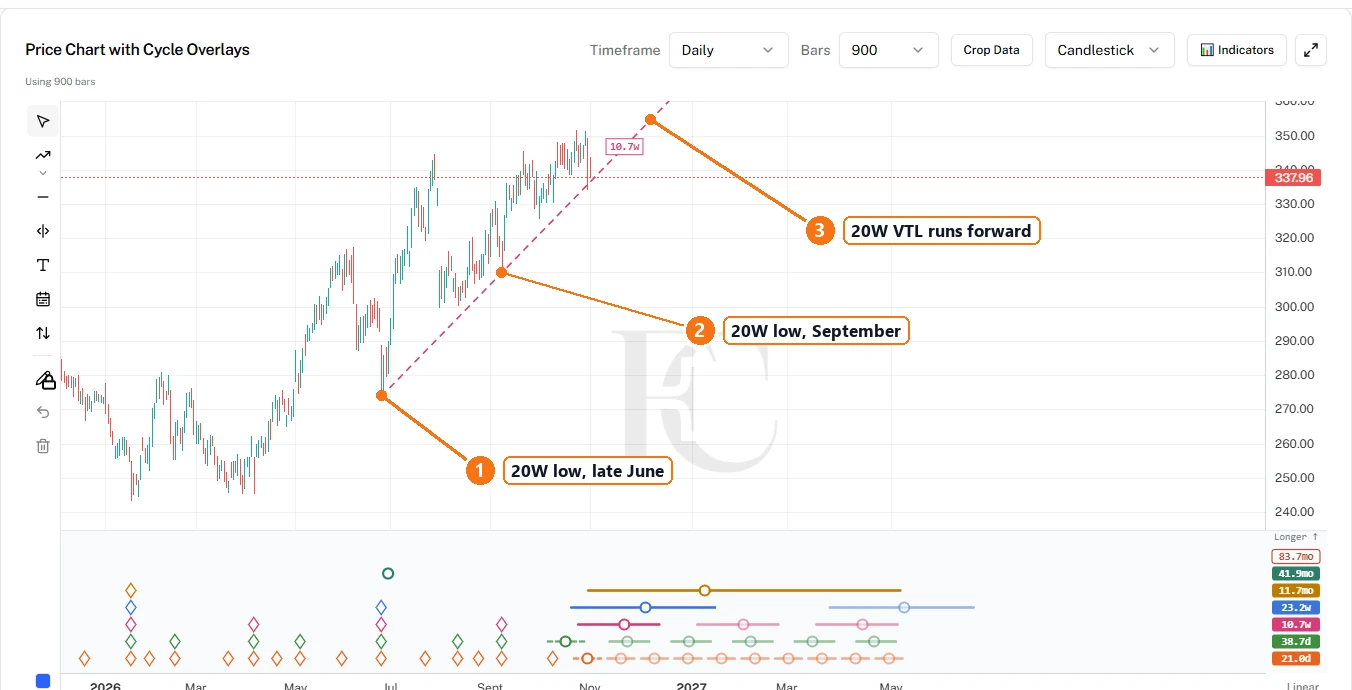
The planPutting it all together: the Hurst cycle trading plan
Each tool answers a different question. Phasing and envelopes tell you when a low is due, the FLD tells you how to get in and roughly how far the move may run, and the VTL tells you when the move is over. Used in sequence, they form the trade plan that Hurst taught.
All the tools on one chart
Time it
Phasing and the envelope show that a major low is due, and roughly where it should form, which gives you a window to watch rather than a date to act on.
Wait
Let price make the low first, rather than trying to catch the exact bottom while it is still falling.
Trigger
In Hurst's plan the entry comes when price crosses up through the FLD, which confirms that the low is in, with a stop placed just under that low.
Target
Project the FLD target and plan the exit around it, and look for a second FLD that points to the same area.
Confirm
A close through the VTL confirms that the larger cycle has peaked, which is the cue to exit or to tighten the stop.
It is worth being clear about what this plan is. It is a teaching example of how Hurst combined his tools, and none of the tools in FractalCycles, today or in the releases still to come, is a signal to buy or sell. What they do is mark areas of interest and the windows where turns have tended to happen, so when price reaches one of those windows, that is your cue to pay closer attention and to judge what you see against your own strategy and your own risk rules.
ChecklistA practical checklist
- Phase the chart from the largest visible cycle down, and confirm that the lows nest cleanly.
- Pick the cycle you want to follow, and then note the one above it, because you want that larger cycle rising.
- Use a centred average and envelope to estimate the timing and price zone of the next low.
- After the low forms, wait for the upside FLD cross, and note where a stop just below the low would sit.
- Project the FLD target, and look for agreement from a second FLD.
- Watch the VTL of the cycle you are following, because a close through it is the cue that the larger cycle has turned.
- Re-phase after every new low, and adjust the plan to what the market is actually doing.
On your chartsSeeing it on your own charts
The real strength of Hurst's approach is that it replaces guesswork with structure. Instead of reacting to every wiggle, you know which wave you are watching, where it is likely to end, and what would tell you it is over. The hard part has always been the drawing, because phasing a chart by hand and keeping every FLD and VTL up to date takes hours, and that is the part FractalCycles now does for you.
The Hurst Tools, which are Hurst Phasing, the FLD, the VTL, the Hurst Envelope and centred Average Lines, have been part of the Pro and Ultra plans since 28 October 2026, and Free members can see them in the menu, locked. Our Hurst Tools guide walks through every switch and label, and the pricing page shows what each plan includes. Start with one market and one cycle, phase it, switch on its FLD and VTL, and watch how the rhythm shows itself.
Common questions
- What is a Hurst cycle trading strategy? It is a way of timing trades with J.M. Hurst's cycle tools. You phase the chart to find where each cycle is, use envelopes to see when the next low is due, use a cross of the FLD as the trigger and to project a target, and use a valid trend line to confirm when the move is over.
- What is the FLD in Hurst cycle analysis? The Future Line of Demarcation is the middle of each bar, halfway between its high and its low, shifted forward by half a cycle plus one bar. A cross of a cycle's FLD is evidence that the next longer cycle has turned, and because the cross tends to come about halfway through the swing, Hurst used it to project how far the move may run.
- What is a valid trend line (VTL)? A valid trend line joins two lows, or two highs, of the same cycle inside one wave of the next longer cycle, with no price crossing the line between them. A close through a rising VTL confirms that the next longer cycle has peaked, and a close up through a falling VTL confirms that it has made its low.
- What is phasing in Hurst cycle analysis? Phasing means marking the lows of each cycle on a chart and checking that they nest, so that every larger low is also a low of each smaller cycle. It is the map that every other Hurst tool reads from.
- What is the Hurst nominal model? It is the list of cycle lengths Hurst found repeating across markets: 18 years, 9 years, 54 months, 18 months, 40 weeks, 20 weeks, 80 days, 40 days, 20 days, 10 days and 5 days. Each is about half the one above it, apart from one step of three between 54 months and 18 months, and the names are labels rather than exact lengths.
- Does FractalCycles draw Hurst's FLD, VTL and envelopes? Yes. Since 28 October 2026 the Pro and Ultra plans include the Hurst Tools, which are Hurst Phasing, the FLD, the VTL, the Hurst Envelope and centred Average Lines. Free members can see them in the menu, locked.
- Are the Hurst Tools a buy or sell signal? No. Nothing on FractalCycles is a buy or sell signal. The tools mark areas of interest and windows where turns have tended to happen, and each reader judges them against their own strategy.
Sources
- J.M. Hurst, The Profit Magic of Stock Transaction Timing, Prentice-Hall, 1970.
- J.M. Hurst, the Cyclitec Services training course, 1973, for the FLD, the valid trend line and phasing.
- Apple (AAPL) daily prices to late October 2026, charted in FractalCycles with 900 bars on screen.